
Data Science
Data Science is an interdisciplinary field that uses scientific methods, processes, algorithms, and systems to extract knowledge and insights from many structural and unstructured data. It is a concept that unifies statistics, data analysis, machine learning, and their related methods in order to understand and analyze actual phenomena with data.
Both the definitions as taken from Wikipedia reflect the importance of Numerical Skills & Statistics in Data Science. Anyone desirous to build a career in data science should develop the following four important skills as shown in the figure below:
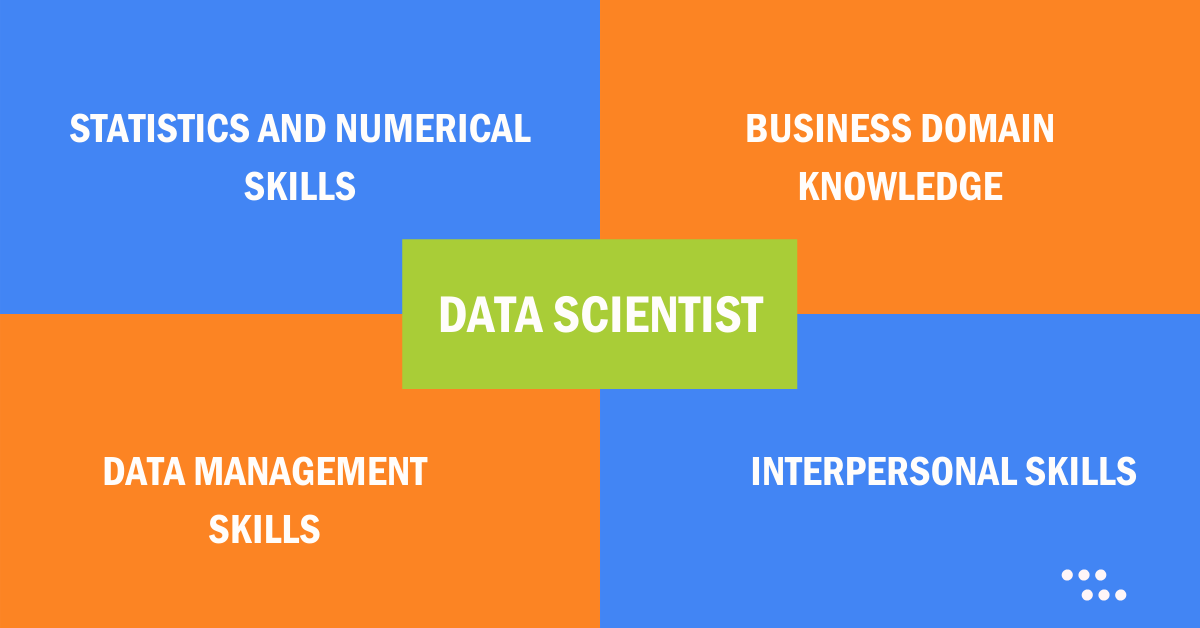
Interpersonal Skills – Data science is an interdisciplinary field. A data scientist is supposed to coordinate and work with team members across departments and functions. S/he has to also be a good storyteller to explain his/her analysis.
Data Management Skills – Data Scientist’s job is to extract knowledge and insights from structural and unstructured data. A data scientist should have a good understanding of programming and data management tools like SQL, R, Python.
Business Domain Knowledge – Data analysis is done to solve business and social problems, as such, it is important for Data Scientist to develop a sound understanding of the domain.
Statistics and Numerical Skills – The job of a Data Scientist is to interpret, infer, extract insights from the analytical output and build mathematical models. For all of these, knowledge of mathematics & statistics is very essential.
There is a saying
” If you don’t know the business, data can teach you.
If you don’t understand the numbers, data won’t help you “
It may not be wrong to say that, statistics and numerical skills are essential skills of a good Data Scientist.
Statistics
Statistics is the discipline that concerns the collection, organization, displaying, analysis, interpretation, and presentation of data. (Wikipedia)
Performing a statistical analysis involves:
- Collection of Data
- Organization of Data (Data Preparation)
- Displaying Data (Charts, Graphs and Tabular representation)
- Data Analysis
- Interpretation of Analysis Output
- Representation of Data and Inferences
Statistics Blog Series
We aim to provide the students and aspiring data scientists with a good resource on statistics. We are confident that you will be able to easily learn many complex concepts of statistics with ease. Moreover, we have provided Python and R code where necessary.
| Sr. No. | Statistics blog-series |
| 1. | Descriptive Statistics – Link |
| 2. | Types of Variables – Link |
| 3. | Measures of Central Tendency – Mean, Median, Mode
Practice Exercises – Link |
| 4. | Measures of Dispersion |
| 5. | Measures of Relationship |
| 6. | Overview of Tabular and Graphical Methods – Link
Steps in Descriptive Analysis of data
|
| 7. | Probability |
| 8. | Distributions |
| 9. | Sampling and Sampling Distribution |
| 10. | Central Limit Theorem |
| 10. | Normal Distribution |
| 11. | Hypothesis Testing |
Thank you
Happy Learning !!!

Know about our Self paced Online and Instructor-led Online courses.
Recent Comments