Metadata
Data that provide information about other data is called Metadata. In other words, metadata is data about data. Metadata is as important as the data itself because it describes the data.
Best practices in variable naming:
- Self-Explanatory Names – Variable names should be self-explanatory
- Naming Consistency – A field referred to in multiple datasets/tables should be referenced by the same variable name. For e..g Customer Identifier field is present in Customer Table and Accounts Table. Let’s say, Customer Identifier field is referred by variable name cust_id in Customer Table, then, the same variable name usage should be there in Accounts Table. It should not be the case that it is referred to as cust_id in one table and cuid in another table.
MBA Students Data Analysis
Continuing from our previous blog, we have to perform the analysis of MBA Students Data. (File Download Link). After downloading the file, what will be your first step?
As a data scientist, you will first eyeball the data. You will check the fields present in the data and try to broadly understand the data. If the metadata is readily available then it would make your task easier.
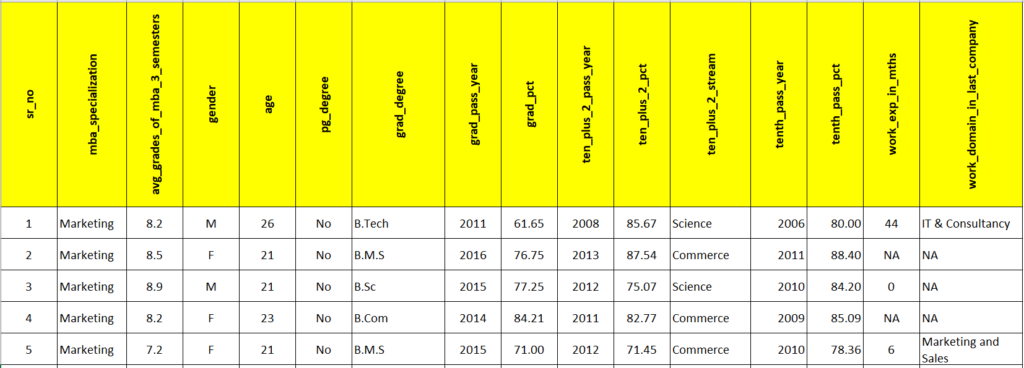
The table below shows a few sample records for you to eyeball.
Metadata of the MBA Students Data
The metadata of the MBA Students data is given below:
| Sr. No | Column Name | Description |
| 1 | sr_no | Serial Number. |
| 2 | mba_specialization | MBA Specialization – Marketing, Finance, HR, Business Analytics |
| 3 | mba_grades | MBA Grades of the students. It is an average of the 4 semesters of MBA |
| 4 | gender | Gender |
| 5 | age | Age of the student in Years |
| 6 | pg_degree | Whether a student has a Post-Graduation Degree?. Yes / No |
| 7 | grad_degree | Graduation Degree. Open field having values like B.Tech, B.Sc, B.M.S, etc |
| 8 | grad_pass_year | Year in which the student passed the graduation |
| 9 | grad_pct | Graduation percentage of the student |
| 10 | ten_plus_2_pass_year | Year in which the student passed the 12th Standard ( 10 + 2 class) |
| 11 | ten_plus_2_pct | Percentage secured by the student in 12th Standard |
| 12 | ten_plus_2_stream | The stream in which the student completed 12th Standard, viz, Science, Commerce, etc |
| 13 | tenth_pass_year | Year in which the student passed the 10th Standard |
| 14 | tenth_pass_pct | Percentage secured by the student in 10th Standard |
| 15 | work_exp_in_mths | Number of months of work experience |
| 16 | work_domain_in_
last_company |
The domain in which the student had worked in their last job. |
Descriptive Analysis
We are now all set to perform the descriptive analysis of MBA Students’ data. Let us jot down a few questions we would like to be answered.
- How is the MBA batch distributed based on the Specialization?
- What is the average age of students in the data?
- How many students have prior work experience? How many months of work experience they carry?
- What is the percentage of female students in the batch?
- How are the students distributed based on their MBA Grades?
- Is there any correlation between MBA Grades and ten-plus-2 standard percentages?
- Is there any association between MBA grades and 12th Standard stream?
There can be many more questions coming to your mind. The answers to these questions and systematic presentation of the same is Descriptive Statistics.
Next Blog
In our upcoming blogs, we will answer the above questions and visually present data as tabular reports and graphical plots. In the next blog, we will cover the Frequency Table, Bar Plot, and Pie Chart.
<<< previous | next blog >>>
<<< statistics blog series home >>>
Recent Comments