
Median
Median is the middle value of the data when the observations are sorted (ascending or descending order)
- When sorted (ascending or descending), the median splits the data into two halves equally (upper and lower halves).
- The percentile rank of median = 50%
- Median is not calculated based on all the values in data and is therefore not impacted by outliers.
- When sorted,
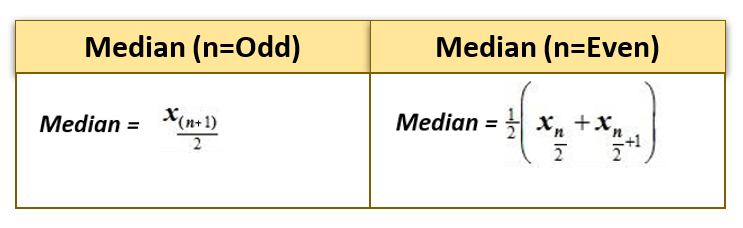
- If the number of observations (n) is odd, then the median is the value of the middle observation at position (n + 1) / 2.
- Else If the number of observations (n) is even, then the median is the mean of the two middle-most values at position ( n/2, (n+1)/2 ) .
Example
There are 15 tiny tots in a preschool and their age in months is given below. Calculate median:
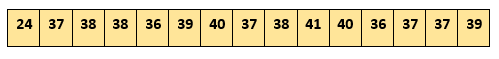
- To find the median, first we sort the values in ascending order (or descending)
- As n = 15 (n is odd), the median will be 8th position value [(15 + 1)/2 = 8].
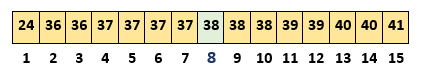
- The value at 8th position is 38, therefore Median = 38
Interpretation
50% of the tiny tots in preschool are below the age of 38 months and the remaining 50% are above 38 months.
Median vs. Mean
There are three preschools in a city and their summary details are given below. Calculate the mean and median for all the three preschools taken together.
| Preschool Name | # Children | Median Age (in months) |
Mean Age (in months) |
| Fun School | 40 | 40 | 41 |
| Play School | 20 | 36 | 35 |
| Enjoy School | 30 | 37 | 37 |
Median represents the value of the central observation in a given sample. From the above table, we cannot compute the median of all three preschools together. To be able to compute the median we will require the age at individual children level.
Mean is computed as the arithmetic average of the values in a sample data. From the above table, We can compute the mean of all three preschools together using Weight Mean calculation but not Median. Dear blog reader, I leave the calculation as a practice for you.
Practice Exercise 1
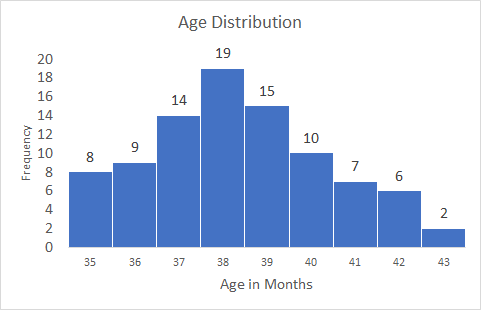
Compute median from the below histogram.
Practice Exercise 2
A small startup has 10 employees including the founders. The monthly salaries of all the employees is given in the table below. Find the median salary.
| Emp. No. | 1 | 2 | 3 | 4 | 5 | 6 | 7 | 8 | 9 | 10 |
| Monthly Salary (k) | 90 | 80 | 18 | 18 | 17 | 16 | 16 | 16 | 15 | 14 |
Next Blog
In the next blog, we will discuss Mode.
Recent Comments