Analysis of Two Continuous Variables
In the earlier blogs, we have learned about the Analysis of Single Continuous and Single Categorical variable. In this blog, we will analyze Two Continuous Variables. The table below summarizes the most commonly used Descriptive Statistics to analyze two continuous variables.
| Graphical Methods | Scatter plot |
| Numerical Methods | Correlation |
| Tabular Methods | Crosstab – To analyze two continuous variables using crosstab, we will have to convert the continuous variables into categorical by binning/bucketing |
Note: The Latin alphabet r or R is used to denote correlation.
Example
For the analysis of two continuous variables, we will considering the following pair of variables from the MBA Students Data.
- Graduation Percentage and MBA Grades
- 10th Standard Percentages and 12th Standard Percentages.
Importing MBA Students Data in R
#Set directory as per your folder file path
setwd("D:/k2analytics/datafile")
getwd()

#Read the File

mba_df = read.csv("MBA_Students_Data.csv", header = TRUE)
1. Graduation Percentage Vs MBA Grades
| Variable | Graduation Percentage | MBA Grades |
|
Variable Name |
‘grad_pct’ |
‘mba_grades’ |
|
Description |
Percentage of Marks secured by students in their graduation degree |
Average Grades of MBA Students in the First three Semesters |
|
Variable Type |
Continuous Variable |
Continuous Variable |
Graphical Method | Scatter plot
Scatter Plot visually represents the linear relationship between two continuous variables. It quickly shows the direction of the correlation between the two variables.
The R code to draw Scatterplot between Students Percentage and MBA Grades is given below.
#Scatter plot for gradution percentage Vs mba grades
plot(mba_df$grad_pct,mba_df$mba_grades,
     col='royalblue',main = "Scatter plot \n Graduation % Vs MBA Grades",
     xlab = 'Graduation Percentages',
     ylab = 'MBA Grades',pch=20
     )
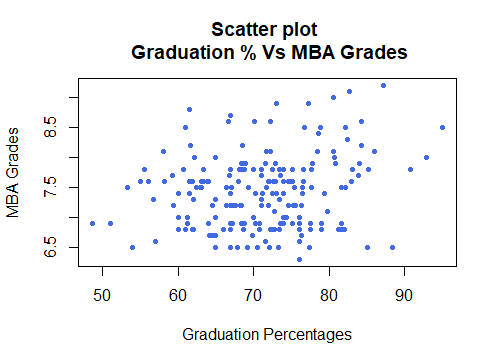
- In the above scatter plot, we observe that a good number of students with a very high percentage of marks in Graduation have also secured good grades in the MBA examination. Whereas students with moderate or below grades have mostly got moderate grades in MBA. Therefore, there is a weak positive correlation between students’ graduation percentage and MBA grades.
- Since the data points are more spread out in the above graph, the strength of the linear relationship between students’ graduation percentage and MBA grades is likely to be very weak. (The strength of linear relationships is measured using correlation)
Numerical Method | Correlation
Correlation is a statistical measure used to calculate the strength and direction of the linear relationship between two variables(X, Y). The code to calculate the correlation between students’ graduation percentage and MBA grades is given below:
#Correlation
corr_1 = cor(mba_df$grad_pct,
             mba_df$mba_grades,
             method = "pearson")
cat("Pearson Correlation between Graduation Percentage and MBA Grades is",round(corr_1,3))
#Output
Pearson Correlation between Graduation Percentage and MBA Grades is 0.211
Interpretation
The Correlation between students’ graduation percentage and MBA grades is 0.211 (weak correlation). It means the student with a high percentage of marks in graduation doesn’t necessarily mean the student will secure good grades in MBA.
Note
- The Weak correlation between the Students’ Graduation Percentage and MBA Grade maybe because of the following reasons
- Students are from different graduation (Like B.E, B.Com, B.Sc)
- Data is the Mix of Students with different specialization(Like Business Analytics, Marketing, Finance, HR)
- The above statements are just hypotheses. A Data Scientist should able to Explore and Investigate the data thrown at them. We leave this to Aspiring Data Scientists. Play with the data and Do more Detailed Exploratory Data.
2. 10th Standard Percentages Vs 12th Standard percentages
| Variable | 10th Standard Percentages | 12th Standard Percentages |
|
Variable Name |
‘tenth_std_pct’ |
‘ten_plus_2_pct’ |
|
Description |
Percentage of Marks secured by students in 10th Standard |
Percentage of Marks secured by students in 12th Standard |
|
Variable Type |
Continuous Variable |
Continuous Variable |
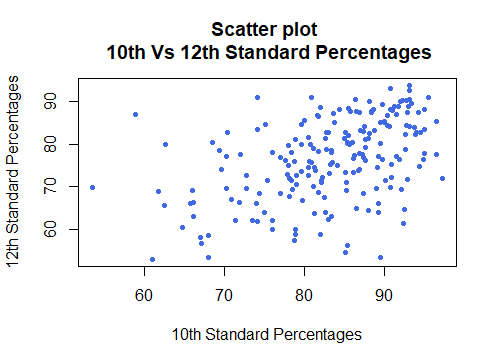
Graphical Methods | Scatter plots
# PRACTICE EXERCISE

# THIS BLOCK IS INTENTIONALLY KEPT BLANK

# WRITE CODE TO MAKE A SCATTER PLOT BETWEEN
# tenth_std_pct AND ten_plus_2_pct

The above scatter plot clearly shows there is a positive linear relationship between students’ 10th and 12th Standard Percentages.
Numerical Method | Correlation
#Correlation
corr_2 = cor(mba_df$tenth_std_pct,
             mba_df$ten_plus_2_pct,
             method="pearson")
cat("Pearson Correlation between 10th and 12th Standard Percentage is",round(corr_2,3))
#Output
Pearson Correlation between 10th and 12th Standard percentage is 0.456
Interpretation
- Since r = 0.456, there is a moderate linear relationship between Students’ 10th and 12th Standard percentages.
Practise Exercise
Analyze the 12th Standard Percentages with Graduation Percentages.
Upcoming Blog
In the upcoming blog, we will learn “Analysis of Two Categorical Variables”
Recent Comments