
Measures of Dispersion
In statistics, dispersion (also called variability, scatter, or spread) is the extent to which a distribution is stretched or squeezed. (Wikipedia link)
It is important to first understand the concept of dispersion before we get into details. Let us assume you are a teacher teaching statistics subject to students in the first year of engineering course and you also teach statistics to students in a Data Science Executive course.
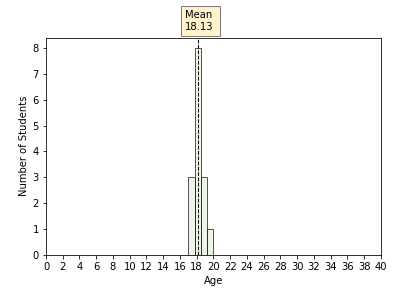
The sample age (in years) of the 15 students from the two different courses and their histogram plot is shown below.
| Sr. No | First Year Engineering Students | Data Science Executive Students |
| 1 | 18 | 22 |
| 2 | 17 | 23 |
| 3 | 18 | 25 |
| 4 | 18 | 27 |
| 5 | 17 | 28 |
| 6 | 18 | 35 |
| 7 | 19 | 32 |
| 8 | 20 | 28 |
| 9 | 19 | 30 |
| 10 | 18 | 40 |
| 11 | 17 | 24 |
| 12 | 18 | 26 |
| 13 | 18 | 27 |
| 14 | 19 | 29 |
| 15 | 18 | 31 |
The mean age of Engineering Students is 18.13 years.
The mean age of the Data Science Executive Course is 28.47 years.
From the mean, we observe that the average age of students in Executive Course is relatively higher than the regular engineering course.
Graphical Methods to describe data
Let us use graphical methods – histogram plot to visually depict the data.
|
First-Year Engineering Students |
 |
| Data Science Executive Students |
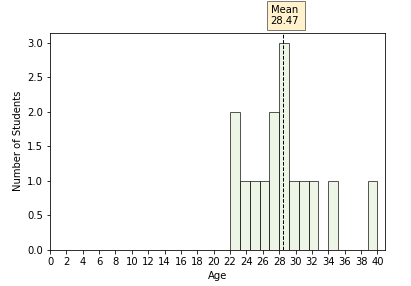 |
From the histogram, we can see that the age of the engineering students is very closely clustered to the mean, i.e. there is less scatter in data. Whereas, the age of data science executive course students is more spread and scattered.
Need of Dispersion
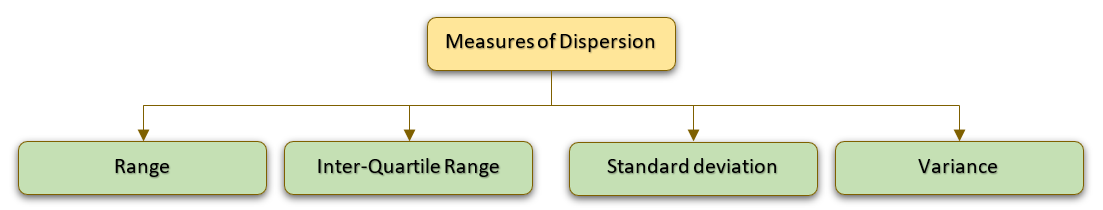
It is clear that mean, which is just a point value, may sometimes not be sufficient to summarize the data. We may require some measures to explain the amount of spread in the data. The statistical measures used to describe the extent to which the data is scattered or squeezed are Measures of Dispersion. The most common measures of dispersion are Range, Inter-Quartile Range, Standard Deviation, and Variance.
In the above example, do you think that knowing beforehand the spread in students’ age would be of help to you?
I think yes. Teaching the engineering students will be relatively easy as there is less dispersion in their age and their expectations from the course would be the same. However, teaching Executive course students would require the trainer to be more prepared with diverse examples and case studies.
Rifle Shooter example to understand the need of dispersion measure
A shooter takes 4 shots on the target. The shots are represented by the 4 red dots.
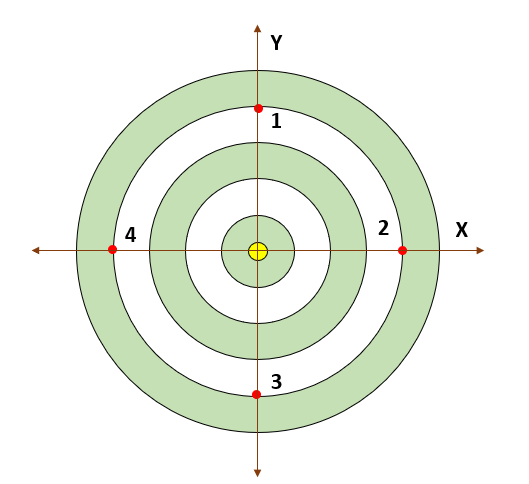
From the visual. it is clear the mean of the 4 shots will be on the Target (Bulls Eye). It is very obvious that by taking the mean statistic we cannot conclude the Shooter has hit Target. This brings us to the need for another important measure called dispersion.
Practice Exercise 1:
Which of the two shooters has high dispersion? Why?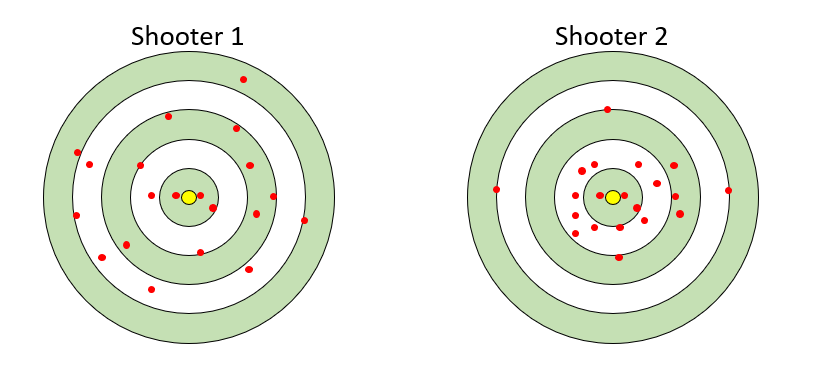
Interpretation and Use of Dispersion Measures
We have so far understood the definition and need of measures of dispersion. It is important to understand the interpretation and usage of dispersion before we get into the mathematical formulae of these measures.
The concept of dispersion is not an easy concept. I am sure most of the blog readers very well know that standard deviation (or variance) is the most used measure to quantify volatility or the spread in data. Many of you will also remember the formula of standard deviation. However very few understand how to interpret or use dispersion.
I will try to explain dispersion in a lucid way. When I come across data having dispersion, I ask myself a few questions:
- How much is the dispersion?
- How do I make use of dispersion in data?
- What are the factors leading to dispersion?
How much is the dispersion in data?
When there is dispersion, the first step is to quantify the dispersion using an appropriate measure like range, interquartile range, standard deviation, or variance. Using mathematical formula you can easily compute the dispersion measures. Having got the value, the next question is what do I do with this measure?
How do I make use of dispersion in data?
Statistic Training example
In our previous blog, we took an example of teaching statistics to engineering students vs data science executive course students. The dispersion is engineering students’ age is less, i.e. they are more homogeneous. Whereas there is more scatter in the age of executive course students, i.e. they are heterogeneous.
How does dispersion in data impact the trainer? How can trainers make use of dispersion in data?
The trainer teaching statistics will be able to easily teach the concepts of statistics to engineering students as the group is more homogeneous. Whereas, the trainer will have to be more prepared while teaching the students of Executive Program. This is because the executive group is more heterogeneous.
Sales & Marketing example
Assume, you are the marketing head of television making company. The customers purchasing the televisions of your company belong to different age groups, income segments, geography (rural-urban), education level, etc. The very fact that the customers have varied demographic and income profile, leads to the fact that there is dispersion.
The most important question for you as marketing head is – how to use the dispersion in customer profile to increase sales?
The obvious answer to this is:
- Create homogeneous customer segments from the heterogeneous data. By creating homogeneous segments, we are reducing the spread within the segment.
- Design television models with different feature combinations to cater to each segment
From both the above examples we see it is important to understand how to use dispersion.
What are the factors leading to dispersion?
Quite often we know that there is dispersion in data. However, at times we may not be able to directly use dispersion in data for sales or marketing. But it may be important for us to understand the factors that lead to dispersion.
Residential Property Price
Assume you collect data of all the property sales transactions in the city of Thane. The sale of properties may have happened at various prices, probably ranging from Rs. 1 million (Rs. 10 Lakhs) to Rs. 50 million (Rs. 5 crores) and above. There would be instances of significant difference in property prices within a locality, within a tower, etc. All this suggest that there is dispersion in property price.
The question here is – What are the factors that influence the property price?
The factors that influence can be locality, carpet area, amenities, distance from public transport system, schools, malls, and other utilities in the vicinity area, etc.
From the above example, it is evident that understanding the factors causing dispersion is more important in this instance.
Next Blog
In this blog, we understood the need and importance of measures of dispersion. In the upcoming blogs, we will get into the mathematics and calculations of dispersion measures – range, interquartile range, standard deviation, and variance.
Recent Comments