Standard Deviation
In this blog, we will understand the concept of standard deviation and variance.
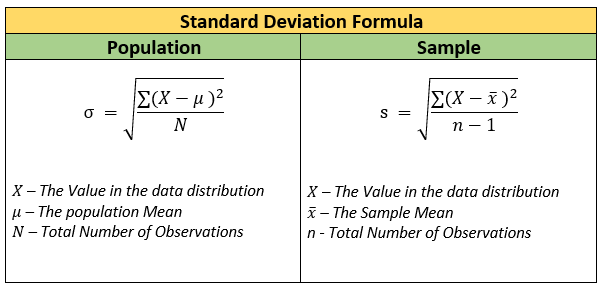
Standard Deviation is a measure of how much the data is dispersed from its mean. A high standard deviation implies that the data values are more spread out from the mean. Standard Deviation is often denoted by the symbol SD or the Greek symbol σ or the Latin letter ‘s’. SD or σ is used for population standard deviation and ‘s’ is used for sample standard deviation.
- The unit of standard deviation is the same as the unit of the variable for which it is being computed.
- Extreme values and outliers will impact the standard deviation.
- Standard Deviation can be zero (if all the values in the variable are the same)
Formula

Variance
Variance is the square of the standard deviation. Being a squared term, it is non-negative. The unit of variance is squared unit, thereby making it less intuitive. Moreover, standard deviation is preferred over variance because standard deviation can be compared with the mean.
The concept of variance has a central role in statistics because it is used to calculate other statistics like ANOVA, R-Squared, hypothesis testing, statistical inference, and more.
Standard Deviation – Hospital Bed Example
A hospital has 100 bed facility. The day-wise demand for beds in the month of Jan 2020 is given below. If there is more demand on any particular day, the hospital will have to refer the patient to some other hospital.
| Jan 2020 | ||||||
| Sun | Mon | Tue | Wed | Thu | Fri | Sat |
| 1 | 2 | 3 | 4 | |||
| 150 | 90 | 120 | 110 | |||
| 5 | 6 | 7 | 8 | 9 | 10 | 11 |
| 65 | 70 | 80 | 130 | 90 | 75 | 70 |
| 12 | 13 | 14 | 15 | 16 | 17 | 18 |
| 100 | 110 | 140 | 90 | 90 | 80 | 75 |
| 19 | 20 | 21 | 22 | 23 | 24 | 25 |
| 75 | 120 | 85 | 90 | 80 | 115 | 115 |
| 26 | 27 | 28 | 29 | 30 | 31 | |
| 90 | 120 | 140 | 150 | 95 | 90 | |
Mean statistic
The mean for the above data is 100.
Given, the hospital has 100 bed facility. Does it imply the hospital will be able to serve all the patients?
No, because the demand is sometimes more than the available number of beds.
How do you quantify the spread in hospital bed demand?
You can quantify the spread in demand using measures of dispersion like range, interquartile range, standard deviation, and variance.
Standard Deviation – The Standard Deviation is 24.5 for the above data. For now, we will not get into the calculation of standard deviation.
(Dear blog-reader, we will discuss the standard deviation calculation steps in our next example. For the time being focus on the importance and interpretation of standard deviation.)
Calculate Variance – Variance is the square of standard deviation. The variance for the above data will be 24.5 * 24.5 = 600. It cannot be directly compared with mean value as such, variance is less intuitive.
Interpretation
An exceedingly high standard deviation in demand suggests that:
- the hospital staff and its facilities would be too stretched on some days of the month
- and it would be too relaxed on some other days of the month.
Standard Deviation – Data Science Certification Program Example
We will now take another example to explain the calculations of standard deviation. Calculate the standard deviation for the sample age data of the 15 students from Data Science Certification Program as given below.

Calculations
STEP – 1: Calculate the Mean
- The mean age of the 15 Data Science Executive Course students is,
- Mean (Age) = (22 + 23 + 25 + 27 + 28 + 35 + 32 + 28 + 30 + 40 + 24 + 26 + 27 + 29 + 31) / 15 => (427 / 15)
- Mean (Age) = 28.47
STEP – 2: Calculate the Standard Deviation
- Let X be the Age of the 15 Data Science Executive Students Sample, Then the Standard Deviation of sample X is,
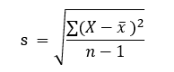
- Let us calculate the standard deviation.
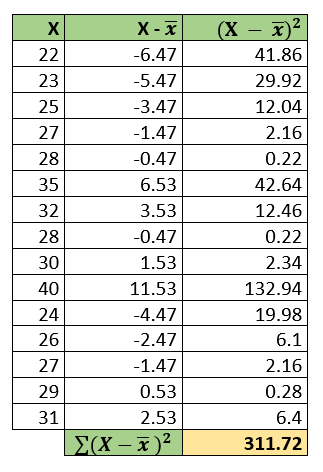
- The total number of observations, n = 15. Hence,
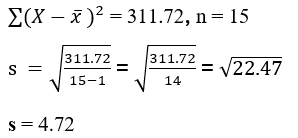
Interpretation
If you note the bracket term in the formula of standard deviation, it is (x – x̅). We are calculating the difference of each observation from the mean. As such, we can interpret the value of 4.72 as the average deviation between the individual observations and mean.
Quite often the Standard Deviation value makes more sense when we compare it with some related dataset. For e.g, the Standard Deviation of Engineering College vs Executive Program students.
The Standard Deviation of Engineering Students data given below is 0.83
| Sr. No | 1 | 2 | 3 | 4 | 5 | 6 | 7 | 8 | 9 | 10 | 11 | 12 | 13 | 14 | 15 |
| First Year Engg Students | 18 | 17 | 18 | 18 | 17 | 18 | 19 | 20 | 19 | 18 | 17 | 18 | 18 | 19 | 18 |
The 0.83 SD in comparison to 4.72 SD of Executive Program suggests that there is more dispersion in Executive Program students as compared to Engineering Students.
Coefficient of Variation
The above example leads us to another important statistical measure of dispersion – Coefficient of Variation (COV). It is a measure of relative variability. CoV is calculated as the ratio of standard deviation (SD) to mean. CoV does not have any unit as it is a ratio of SD to mean.
Applications of CoV – Investment Decision Example
CoV is useful for comparison of variability between two variables or two tests. It can be used for comparison only for ratio-scale variables.
Suppose you have an option to invest in Mutual Fund A or Mutual Fund B. The two mutual funds have different expected returns and standard deviations. The expected return of Mutual Fund A is 15% and Mutual Fund B is 10%. The standard Deviation of the returns of these Mutual funds is 10% and 5% respectively. Which is a better investment?
For a risk-averse investor, Mutual Fund B would be better investment because its CoV (5% / 10% = 0.5) is less than the CoV of Mutual Fund A (10% / 15% = 0.67)
Exploratory Data Analysis Example
Assume, you are working as a data scientist. You are analyzing the data of Retail Customers. Between the two variables Age and Spend, you have to decide which variable has more variability.
The mean age of customers is 30 years with a standard deviation of 6
The mean Spend of customers is Rs. 6000 with a standard deviation of 1000
From the absolute value of standard deviation, you cannot say whether Age has more variability or Spend. This is because the two variables have different units. Age is in Years and Spend is in Rs.
Assume the Age information is given to you in days. Then the standard deviation of age would be 6 * 365 = 2190 days instead of 6 years. So to be able to compare the two variables we will have to compute the Coefficient of Variation.
CoV Age = standard deviation / mean = 6 / 30 = 0.20
CoV Spend = 1000 / 6000 = 0.167
As CoV of Spend is less than Age, we conclude that the variance in Age is more than Spend.
Practice Exercise 1
For the above hospital bed example calculate the following:
- Measures of Central Tendency – Mean, Median, and Mode
- Measures of Dispersion – Range, Interquartile range, Standard Deviation and Variance
Practice Exercise 2
A small start-up has 10 employees including the founders. The monthly salaries of all the employees are given in the table below:
| Emp. No. | 1 | 2 | 3 | 4 | 5 | 6 | 7 | 8 | 9 | 10 |
| Monthly Salary (k) | 90 | 80 | 18 | 18 | 17 | 16 | 16 | 16 | 15 | 14 |
Calculate the standard deviation of the salary?
Is there any outlier or extreme values in the above table? If yes, which values are outliers?
Calculate the standard deviation by removing the outliers.
Next blog:
We will discuss Measure of Relationship – Covariance and Correlation.
really good explanation 👏👍