
Analysis of Two Continuous Variables
Scatter plot and Correlation are a great way of analyzing two continuous variables. A Scatter plot quickly helps us see the relationship between two continuous variables X and Y. Correlation quantifies the strength of the linear relationship.
Analysis of the MBA Data continued…
For analysis of two continuous variables, let us take the following two examples:
- Graduation Percentages and MBA Grades (grad_pct vs mba_grades)
- 10th Standard Percentages and 12th Standard Percentages (tenth_std_pct vs ten_plus_2_pct)
Data Import in Python
# Import the required packages
import pandas as pd
import os
import matplotlib.pyplot as plt
import seaborn as sns

%matplotlib inline
# set directory as per your file folder path
os.chdir("d:/k2analytics/datafile")


# read the file
mba_df = pd.read_csv("MBA_Students_Data.csv")
Scatter Plot of Graduation Percentages vs MBA Grades
plt.figure(figsize=(9,5))
plt.scatter(x = mba_df["grad_pct"],
            y = mba_df['mba_grades'])

plt.title("Scatter Plot \n Graduation % vs MBA Grades",
          fontsize=20)
plt.xlabel("Graduation Percentages", fontsize=15)
plt.ylabel("MBA Grades", fontsize=15)
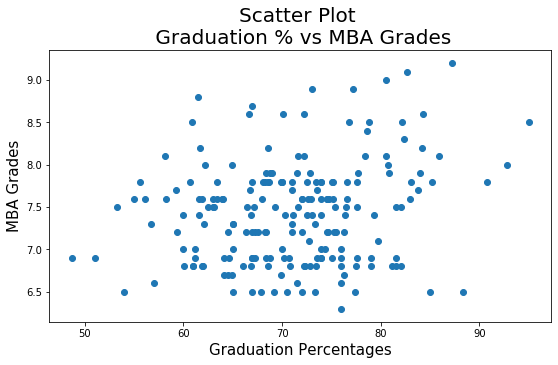
A close observation of the graph shows that the dots are drifting on the higher side of the Y-axis as we move the lower side of the X-axis to the higher side. This indicates that there is a positive correlation between Graduation Percentages and MBA Grades, however, the strength of the relationship is very weak.
Scatter Plot of Standard X Percentages vs XII Percentages
# PRACTICE EXERCISE

# THIS BLOCK IS INTENTIONALLY KEPT BLANK

# WRITE CODE TO MAKE A SCATTER PLOT BETWEEN
# tenth_std_pct AND ten_plus_2_pct
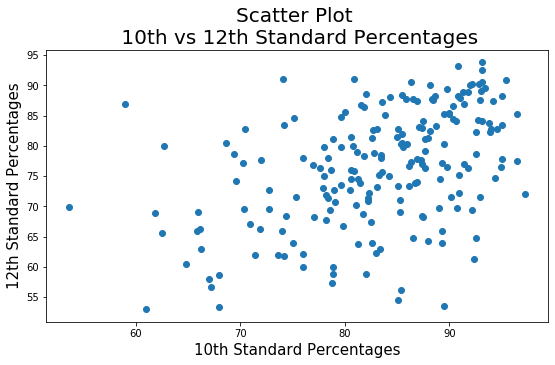
The above scatter plot clearly shows a positive correlation between the 10th and 12th Standard Percentages.
Correlation
The scatter plot help us visually see the direction of the relationship between two variable but does not quantify the strength of the relationship. Correlation is a measure used to quantify the strength of the linear relationship between two continuous variables. Python code for correlation is given below:
from scipy.stats import pearsonr
corr_1, pValue_1 = pearsonr(mba_df["grad_pct"], mba_df['mba_grades'])
corr_2, pValue_2 = pearsonr(mba_df["tenth_std_pct"], mba_df['ten_plus_2_pct'])

print('Pearsons Correlation:')
print('between Graduation Percentages and MBA Grades : %.3f' % corr_1)
print('between 10th and 12th Standard Percentages    : %.3f' % corr_2)
Pearsons Correlation:
between Graduation Percentages and MBA Grades is 0.211
between 10th and 12th Standard Percentages is 0.456
Inferences / Take away
From the above scatter plot and correlation, we can have the following take-aways:
- There is a weak correlation between MBA Grades and Graduation Percentages. A student having very good grades in graduation does not necessarily mean the student will pass the MBA with flying colors.
- There is a moderately strong correlation between the 10th and 12th Standard Percentages. A student who has secured very good percentages in the 10th standard is very likely to get good percentages in the 12th standard also.
Note
- The weak correlation between MBA Grades and Graduation Percentages maybe because the Graduation Degree is a mix of B.COM, B.E., B.M.S, etc.
- Likewise, the weak correlation may be because the data is a mix of MBA Specialization in Finance, Marketing, HR, and Business Analytics
The above statements are just hypotheses. A Data Scientist should have the inquisitiveness to explore and investigate. I leave this as a food for thought for you, the Aspiring Data Scientist, to do a more detailed Exploratory Data Analysis.
Practise Exercise
Analyze the 12th Standard Percentages with Graduation Percentages.
Upcoming Blog
In the upcoming blog, we will learn “Analysis of Two Categorical Variables”
<<< previous | next blog >>>
<<< statistics blog series home >>>
Recent Comments