In this blog, we will learn to build a single variable logistic regression using Python and also interpret the model summary output.
Business Objective Overview
MyBank wishes to develop a Direct Marketing Channel to sell their loan products to existing deposit account customers. The bank executed a pilot campaign to cross-sell personal loans to its existing customers. A random base of 20000 customers was targeted with an attractive personal loan offer and processing fee waiver. The data of the customers who were targeted and their response to the marketing offer has been provided. The data is in the file (LR_DF.csv) and it can be downloaded from our resources section.
Data
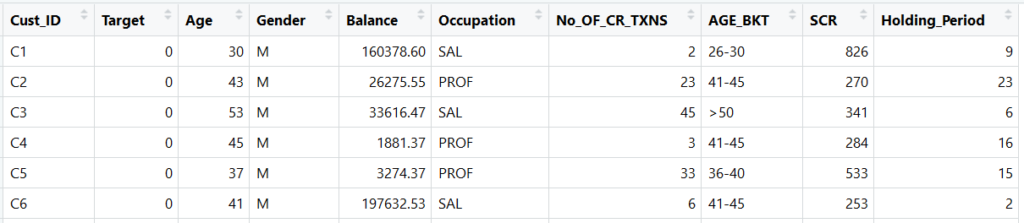
The sample few records of the campaign data are shown below:
Import Code
Metadata Understanding
Metadata is data about the data, i.e., it is the description of the data. It is very important to have metadata understanding before jumping into model development.
| Sr. No. | Column Name | Description |
| 1. | Cust_ID | Customer ID (Unique) |
| 2. | Target | Dependent Variable (1: Responder to the campaign offer; 0: Non-responder) |
| 3. | Age | Age of the customer |
| 4. | Gender | Gender (M: Male, F: Female, O: Others) |
| 5. | Balance | Average Quarterly Balance |
| 6. | No_OF_CR_TXNS | Number of Credit Transaction in recent last 3 months |
| 7. | AGE_BKT | Age Bucket |
| 8. | SCR | Internal generic marketing score maintained by MyBank |
| 9. | Holding_Period | The ability of the customer to retain (hold) money in the account. Unit: days |
Descriptive Statistics and Exploratory Data Analysis
The next step after metadata understanding is performing a detailed descriptive analysis of each and every variable. We have explained Descriptive Statistics in detail in our Statistics Blog Series. Some of the important links you may wish to read are:
- Analysis of One Continuous Variable
- Analysis of One Categorical Variable
- Analysis of Two Continuous Variables
- Analysis of Two Categorical Variables
- Analysis of Two Variables – One Categorical and other Continuous
Build a Logistic Regression Model
Logistic Regression Model with One Continuous Independent Variable
Let us model the Target (dependent variable) with SCR (continuous independent variable).
# Syntax to build Logistic Regression Model in Python
import statsmodels.formula.api as sm
import statsmodels.api as sma
# glm stands for Generalized Linear Model
mylogit = sm.glm( formula = "Target ~ Balance",
    data = mydata_dev,
    family = sma.families.Binomial() ).fit()

mylogit.summary()
# Syntax to build Logistic Regression Model in R

mylogit <- glm( formula = Target ~ SCR,
    data = LR_DF, family = "binomial" )

summary(mylogit)
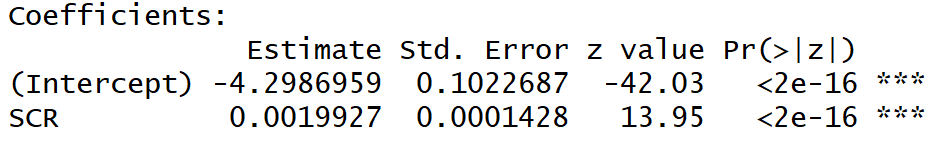
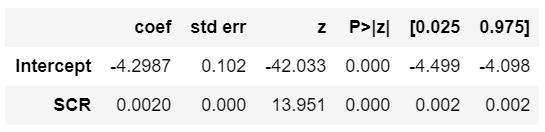
Interpretation of Coefficients table
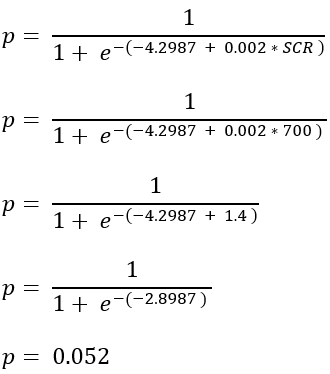
The above coefficients expressed in the logistic regression function would be:
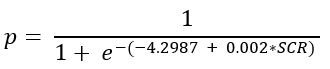
The beta coefficient of SCR is positive, it indicates that the probability (p) has a positive correlation with SCR.
Predicting Probabilities
- Probability if the SCR of the customer is 700
Logistic Regression Model with One Categorical Independent Variable
Let us model the Target (dependent variable) with Gender (categorical independent variable).
# Gender variable frequency distribution
# Gender variable has three categories – M, F, O
LR_DF["Gender"].value_counts()
mylogit = sm.glm(formula = "Target ~ Gender",
     data = mydata_dev,
     family = sma.families.Binomial()
     ).fit()

mylogit.summary()
# Gender variable frequency distribution
# Gender variable has three categories – M, F, O
table(LR_DF$Gender)
mylogit <- glm( formula = Target ~ Gender,
     data = LR_DF, family = "binomial" )

summary(mylogit)
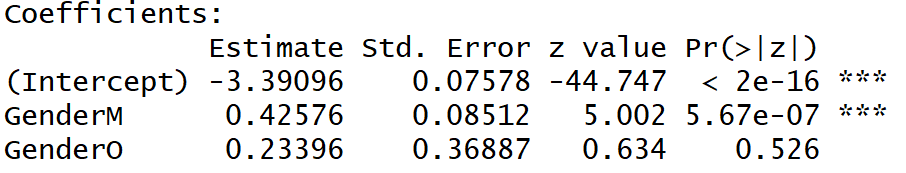
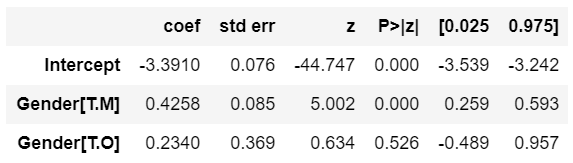
Interpretation of Coefficients table
- The above coefficients expressed in the logistic regression function would be:

- The beta coefficients of Gender variable are given only for two categories (M, O) out of the three categories (F, M, O). This is because one of the categories is considered as a baseline and its effect is captured in the intercept.
- The choice of the baseline for the categorical variable is done based on alphabetical ascending order. In the above example, category F is considered as a baseline and its beta coefficient is 0.
- The p-value of one of the categories of Gender “O” is not significant. How to handle insignificant variables is covered in our subsequent blogs.
- Within a categorical variable, the category having the highest response rate should also have the highest beta coefficient. From the table shown below, we can see the beta coefficient is in order of the response rate.
| Gender | Target = 1 | Total Obs. | Response Prob. | Beta Coefficient |
| F | 180 | 5525 | 0.033 | 0 |
| M | 700 | 14279 | 0.049 | 0.4258 |
| O | 8 | 196 | 0.041 | 0.2340 |
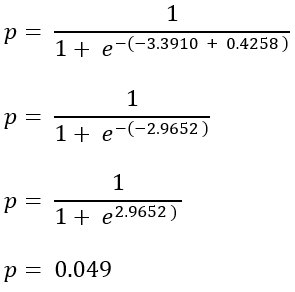
Predicting Probabilities
- Probability if the customer is Male
Practice Exercise
- Build a model using SCR and Gender variable together
- Estimate the probability assuming the customer SCR = 700 and Gender = M
<<< previous blog | next blog >>>
Logistic Regression blog series home
Recent Comments