Why Hypothesis Testing?
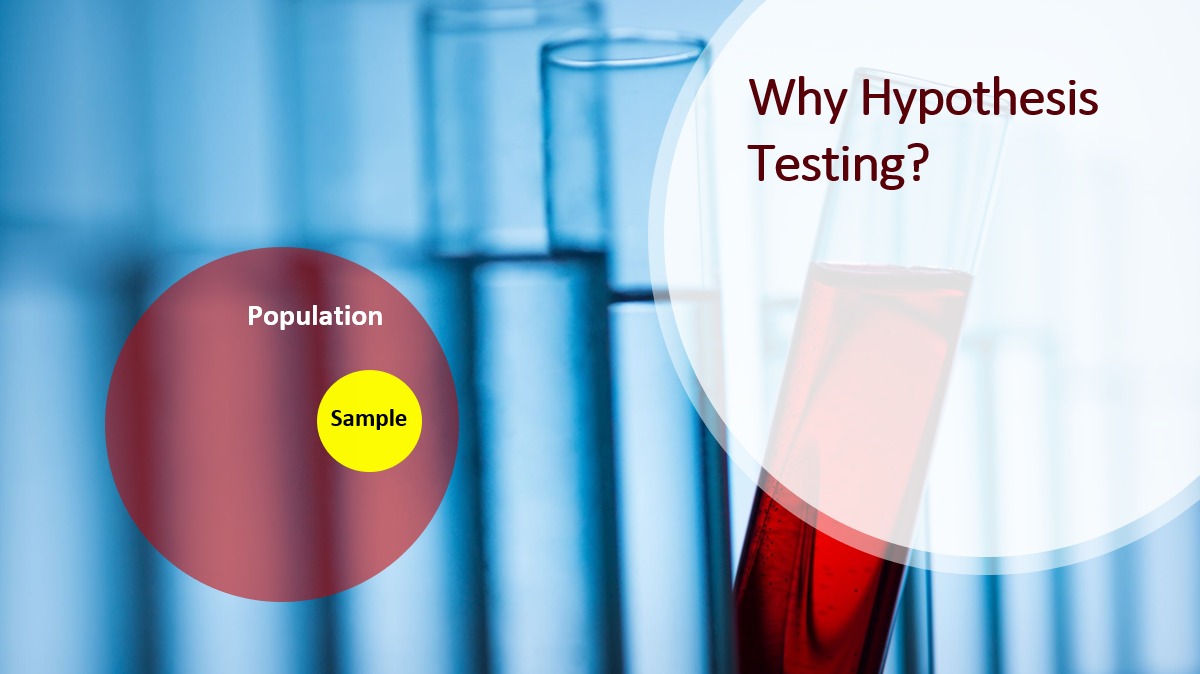
In Statistics, we use sampling to derive inference about the population from the sample. A sample can have a sampling error. The sampling error may sometime lead to wrong inferencing or conclusion. Therefore, the challenge is – How confident you are about the inference derived from the sample? The answer to this is Hypothesis Testing. Hypothesis Testing is the statistical process of ascertaining the confidence level in the inference derived from the sample.
What is a Hypothesis?
A hypothesis is an assumption, it is a conjecture, it is your opinion about the topic.
A hypothesis is a supposition or proposed explanation made based on limited evidence. It is an educated guess about your understanding of the topic.
A hypothesis being an opinion may or may not be true. You ascertain the truth of your opinion by hypothesis testing.
It is very important to have an opinion. With data, we can validate our opinion and check whether it was right or wrong. To be a successful Data Scientist, you should hone the skill of Hypothesis Development and Hypothesis Testing.
Null & Alternate Hypothesis
The hypothesis is framed as Null Hypothesis and Alternative Hypothesis.
Null Hypothesis Ho :
- A Null Hypothesis is the status quo.
- There is no relationship or association between two measured phenomena. Any observed association or relationship might have occurred by chance.
Alternate Hypothesis Ha :
- An Alternate Hypothesis is a hypothesis contrary to the Null Hypothesis.
- The observations are the results of a real effect of association or relationship between two measured phenomena.
Framing Hypotheses for Regression Model Development
Assume, MyBank has assigned you the task of building the predictive model for personal loans cross-sell. The bank has given you the data of 20000 customers offered with an attractive personal loan. 888 out of the 20000 customers responded to the offer. You being the Data Scientist have to build the predictive model.
In model development, we require strong predictor variables (independent variables) to accurately predict the target phenomenon (dependent variable).
Null Hypothesis: there is no relationship between the dependent and independent variables.
Alternate Hypothesis: there is an association between the dependent and independent variables.
How to frame the Hypothesis?
The starting point is to get an understanding of the Domain / Business Problem at hand. Then, try to relate the objective statement with your gut feeling. E.g. For the MyBank Personal Loans model, you may start with a few questions like:
Why do customers take personal loans?
Customers take personal loans when they are in urgent need of funds for a short period. They may use the fund to pay off hospital bills, personal expenses, child education, marriage, vacation, or any other purpose.
What are the benefits of personal loans?
- A personal loan is an unsecured loan.
- The loan taker does not have to give any security for taking personal loans.
- You can take the loan for a short-term or a medium-term duration.
- The personal loan rate of interest is moderate. It is much lower than the rate charged on credit card outstanding.
How do I determine the customers’ need for a loan from data?
I can probably determine the need for a loan from the customers’ bank balance, income level, or cashflow. Relate these attributes with the objective statement and you have framed the Hypothesis statement. It is that easy. Listed below are a few hypotheses:
- Low bank balance customers are more likely to require a personal loan (in comparison to customers having relatively higher balance)
- Customers having a monthly salary of less than Rs. 25000 are more likely to require loans
- Customers having more debit (cash outflow) transactions as compared to credit (cash inflow) will be financially stretched. As such, they may require a personal loan.
- Customer revolving on their credit card may take a personal loan to pay off the credit card dues.
Does demographics play any role in personal loan need?
Maybe, may not be. You can hypothesize the relationship between personal loan needs and demographics attributes of the customer. E.g.
- Male customers may be more willing to take a personal loan when in need, whereas, females may try to avoid/prolong the decision of taking a loan.
- Middle-aged customers have more family responsibilities like children’s education, vacation, or marriage; As such, they are more likely to take a personal loan compared to the youth or old-aged customers.
Note: If you have little or no domain experience, then you should do brainstorming with stakeholders to generate the hypotheses.
Hypothesis Tests
There are many types of hypothesis tests. The commonly used hypothesis tests are:
| Hypothesis Test | Application |
| Z test | Z–test is used to test the mean of a distribution. It is applied when the test statistic distribution can be approximated to a normal distribution, the population variance is known, and the sample size is large. |
| t-test | t-Test is used to determine whether there is a significant difference between the means of two groups. |
| One Way ANOVA | The one-way analysis of variance (ANOVA) is used to determine whether there are any significant differences between the means of three or more independent (unrelated) groups. |
| CHI-SQ test | CHI-SQ test is a non-parametric test and has two applications. 1. Test of Independence between two categorical variables. 2. Goodness of Fit between the observed and the expected frequencies. |
Hypothesis Testing Process
Hypothesis Testing is a four-step process:
1. Formulate the null hypothesis and the alternate hypothesis.
2. Identify a suitable test statistic to validate the hypothesis.
3. Execute the hypothesis test. The test will give a p-value (probability value) output. The easy and simple interpretation of the p-value is – “The smaller the p-value, the stronger the evidence against the null hypothesis”.
4. Compare the p-value to an acceptable significance value α (alpha value ). If p <= α, then the observed effect is statistically significant, i.e., the null hypothesis is ruled out, and the alternative hypothesis is valid.
Note: The α value is typically assumed to be 0.05. However, many companies tend to set the acceptable significance value to be 0.0001 for model development.
Interpretation of p-value
If the p-value of an independent variable is less than α, then the independent variable is considered to be a significant (important). If the p-value is above the acceptable significance value, then the variable may be considered to be not influencing the dependent variable.
Practice Exercise
Assume you have to build a model for Personal Loans Cross-Sell to Savings Account customers. Write 50 hypotheses on behavioural patterns that can help determine the customers’ need for a personal loan.
Related reading:
Statistics for Data Science
Predictive Analytics – Science or Art
Additional Reference reading on Hypothesis Testing
Recent Comments