
Information Value (IV)
Information Value is the most used concept for variable selection in the Logistic Regression scorecard development process. Information Value is a measure of the predictive power of a variable to separate the Good Customers from Bad Customers. IV helps us quantify the predictive power of the independent variables and relative rank them.
Information Value Formula & Calculations
Assume we have data having two classes Good and Bad. Good customers are the one’s who have not defaulted on their loans. Bad customers have defaulted on their loans. Age be the predictor variable for which we wish to compute the IV. The initial three columns in the table below show the age-wise distribution of Good & Bad customers. The rest of the columns details the calculation steps to compute IV.
Note: The IV for a continuous predictor variable is computed by converting it to categorical using binning/bucketing.
Information Value Calculation
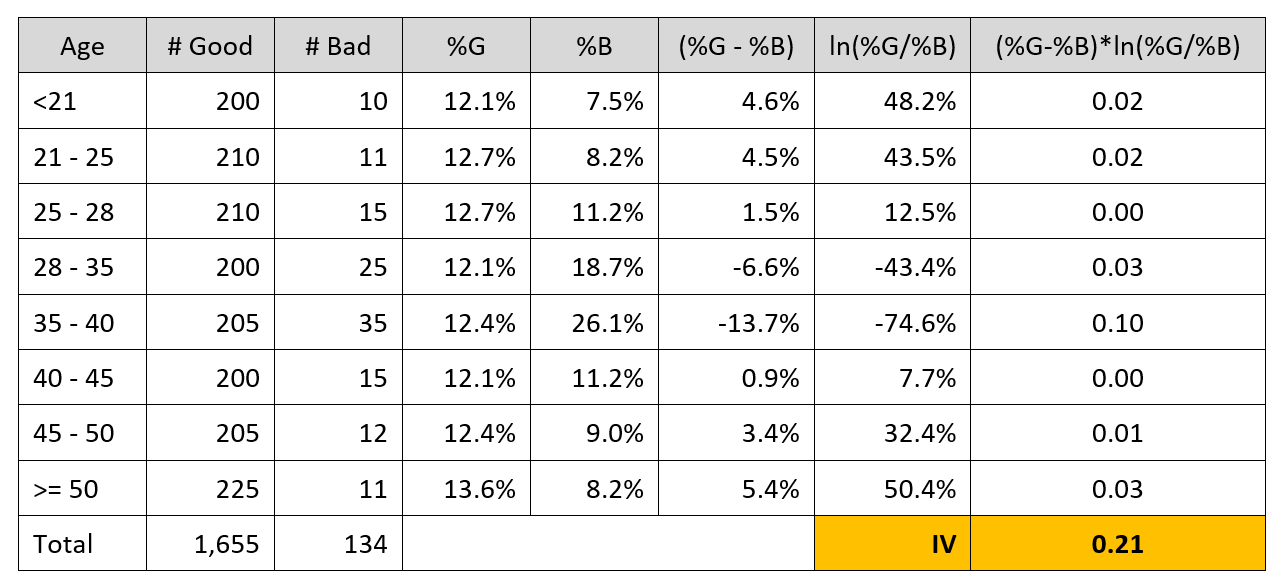
Explanation of Information Value Calculation Steps
Step 1: Convert the Continuous variable to categorical
Step 2: Aggregate the data at the category level. Get the count of Good and Bad class customers in each category.
Step 3: Convert the absolute numbers to proportions. The proportions are shown in %G and %B column in the above table.
Step 4: Compute the difference between %G and %B, i.e (%G – %B), for each bucket
Step 5: Calculate ln(%G/%B)
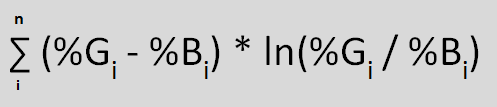
Step 6: Compute summation of (%G – %B) * ln(%G/%B). The summation is the Information Value of the variable.
An analogy to understand Information Value
The concept of Information Value in data science is equivalent to the concept of Torque in physics. Suppose that ln(%G / %B) is equivalent to Force and (%G – %B) is the Distance as shown in the figure below:
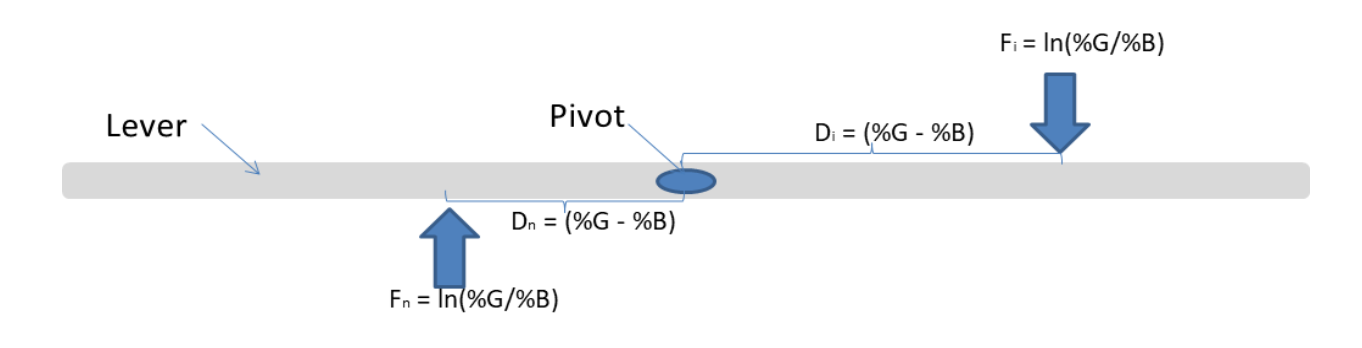
Torque = Force * Distance. The torque generated is the summation of Force * Distance and will be maximized if the Force is applied at farthest Distance; Work is done when torque rotates an object, e.g. Wheels of a Car.
In physics, more the Torque, more Work can be done. Likewise, in data science, a variable having high IV is considered to have more predictive power to separate the two classes, i.e., Good & Bad.
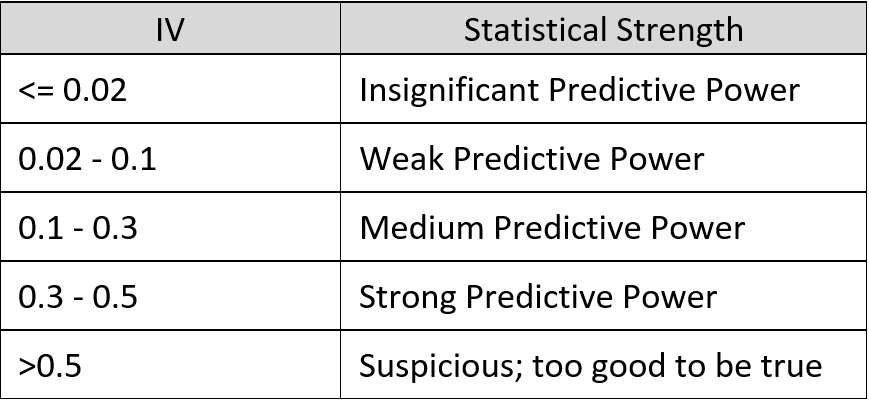
Interpretation of Information Value
The interpretation of the IV value is given in the table below:
Information Value Code in Python
The code to compute information value in python is given below.
## Information Value
## Download the k2_iv_function.py file from our website resource section
exec(open("k2_iv_function.py").read())
iv = iv(df = dev.iloc[:,1:],target = "Target")
iv
| Var | IV | |
|---|---|---|
| 0 | Balance | 0.436598 |
| 1 | No_OF_CR_TXNS | 0.358081 |
| 2 | Holding_Period | 0.330997 |
| 3 | SCR | 0.283619 |
| 4 | Occupation | 0.227025 |
| 5 | Age | 0.117505 |
| 6 | AGE_BKT | 0.107739 |
| 7 | Gender | 0.029404 |
Interpretation of the IV Output
- Strong predictor variables in our dataset are Balance, Holding Period, and No. of Credit Transactions
- Age, Score (SCR) and Occupation are moderately strong predictor variables
- Gender has insignificant predictive power
Information Value Code in R
The R Programming code to compute IV is given below. We have used the “tomasgreif/riv” package from Github for the computation of IV.
## Packages required for IV calculation in R

## Uncomment the below two install.packages syntax for installation
##install.packages("devtools")
##install_github("tomasgreif/riv")


library(devtools)

library(woe)
## woe package require the row index to be sequential numbers

rownames(dev) = NULL
iv <- iv.mult(
  dev[,!names(dev) %in% c("Cust_ID")],
  "Target", summary = TRUE, verbose = FALSE)

iv
Note: The marginal difference in IV output of Python / R is because the sampling dataset “dev” might not be the same. In case you wish to compare the output then use the same dataset.
<<< previous blog | next blog >>>
Logistic Regression blog series home
Recent Comments