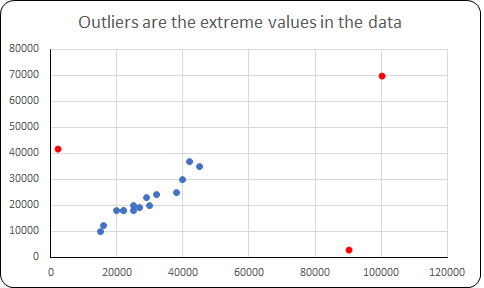
Outlier
Outliers are the extreme values in the data. If the value of a variable is too large or too small, i.e, if the value is beyond a certain acceptable range then we consider that value to be an outlier. A quick way to find outliers in the data is by using a Box Plot.
Outlier Treatment
The treatment of the outlier values/cases is called Outlier Treatment. Typically outlier treatment is done by capping/flooring.
- Capping is replacing all higher side values exceeding a certain theoretical maximum or upper control limit (UCL) by the UCL value. Statistical formula for UCL is UCL = Q3 + 1.5 * IQR
- Flooring is replacing all values falling below a certain theoretical minimum or lower control limit (UCL) by the LCL value. Statistical formula for LCL is LCL = Q1 – 1.5 * IQR
There may be some instances where you may want to delete the record having an outlier value. However, the deletion of a record should be considered as an option only when other outlier treatment options are not acceptable.
Note: This blog is a continuation of our Logistic Regression Blog Series
Python code | Finding Outlier using Box Plot
import matplotlib.pyplot as plt
import seaborn as sns
%matplotlib inline
plt.figure(figsize=(9,5))

boxplot = sns.boxplot(x="Balance",
                 data=dev, showmeans=True,
                 width=0.5,
                 palette="colorblind")

plt.title("Box Plot of Balance", fontsize=20)
plt.xlabel("Balance", fontsize=15)
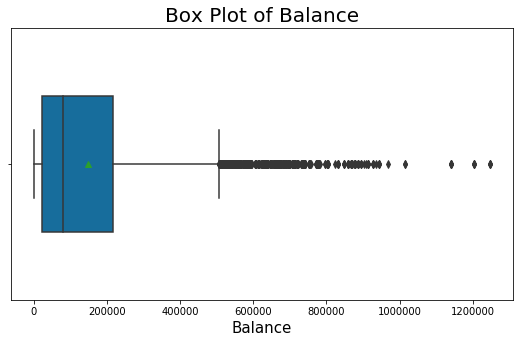
From the box plot, we observe that there are outlier values after 500000.
We compute the Upper Control Limit using the formula: UCL = Q3 + 1.5 * IQR
Python code | Compute UCL
#Getting Upper Control Limit value for Balance
Q1, Q3 = dev["Balance"].quantile([0.25,0.75])
UCL = Q3 + 1.5 * (Q3 - Q1)
print("UCL = ", round(UCL))
Python code | Capping of Outlier Values
# If value above 500000 then replace by 500000
####### Best Practice #######
# when you do outlier treatment, you should create a new variable


dev["Bal_cap"] = dev["Balance"].map(
    lambda x: 500000 if x > 500000 else x
)
R code for Outlier Treatment
The Python equivalent code in R is given below.
# Box Plot
boxplot(dev$Balance,
        main = "Box Plot of Balance",
        xlab = "Balance",
        col = "royalblue",
        border = "black",
        horizontal = TRUE)

# UCL - Upper Control Limit
Q = quantile(dev$Balance, c( 0.25, 0.75))
Q1 = Q[1]
Q3 = Q[2]
UCL = Q3 + 1.5 * (Q3 - Q1)
cat("UCL =" , round(UCL,0))

# Capping the Balance variable
# Creating new variable Bal_cap

dev$Bal_cap = ifelse(dev$Balance > 500000, 500000, dev$Balance)
<<< previous blog | next blog >>>
Logistic Regression blog series home
Recent Comments