
Pre-read: This blog is part of the Linear Regression in Machine Learning blog series.
Multicollinearity
In regression, Multicollinearity is a phenomenon when two or more independent variables are highly intercorrelated, meaning that, an independent variable can be linearly predicted from one or more other independent variables. The statistical test to check for multicollinearity in data is Variance Inflation Factor (VIF).
Why is Multicollinearity a problem?
Multicollinearity negatively impacts the stability and significance of the independent variables. The problems of multicollinearity are:
-
- The beta estimates of the collinear independent variables can erratically change for small variation in the sample data.
- The beta estimate sign (+ or -) may sometime come contrary to expectation due to multicollinearity.
- A significant explanatory variable can become insignificant as some of its explanatory power is captured by the variable multicollinear to it.
Example to understand Multicollinearity Problems
In our inc_exp_data.csv data, the independent variables Mthly_HH_Income and Annual_HH_Income are correlated to each other. Both the independent variables have a positive correlation with Mthly_HH_Expense (dependent) variable. To see the problems of multicollinearity, we will run regression with correlated independent variables:
# Model with Multicollinear Variables
import statsmodels.formula.api as sma

m_linear_mod = sma.ols(
formula ="Mthly_HH_Expense ~ Mthly_HH_Income + \
     No_of_Fly_Members+ Emi_or_Rent_Amt + Annual_HH_Income",
     data = inc_exp).fit()

m_linear_mod.summary()
m_linear_mod <- lm(
  Mthly_HH_Expense ~ Mthly_HH_Income + No_of_Fly_Members
  + Emi_or_Rent_Amt + Annual_HH_Income,
  data = inc_exp )

summary(m_linear_mod)
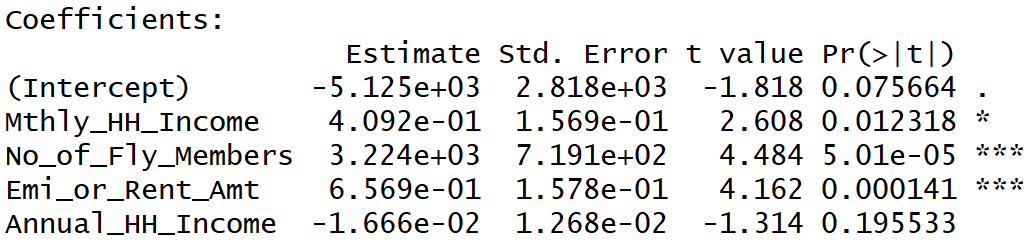
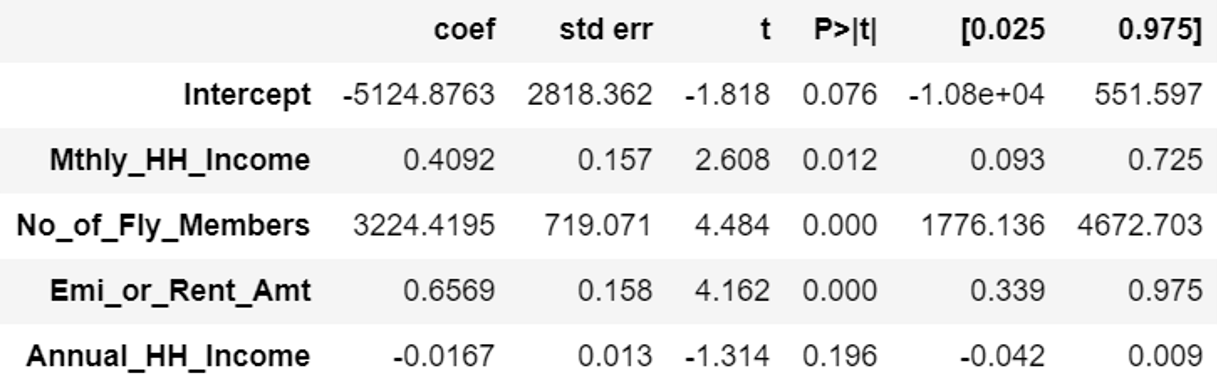
Regression Output Interpretation
We observe that due to multicollinearity:
- the beta coefficient sign of Annual_HH_Income is negative despite it having a positive correlation to the dependent variable
- the Annual_HH_Income variable has become insignificant
- the Mthly_HH_Income variable has become relatively less significant
Practice Exercise
1. Exclude the Annual_HH_Income variable and run the regression.
2. Similarly, execute the linear regression by excluding Mthly_HH_Income.
3. Compare the beta coefficients and p-values.
4. Draw inferences to better understand the concept of multicollinearity
How to find Multicollinearity? What is Variance Inflation Factor?
In regression, Variance Inflation Factor (VIF) is the test for multicollinearity. The formula for computing the VIF is:
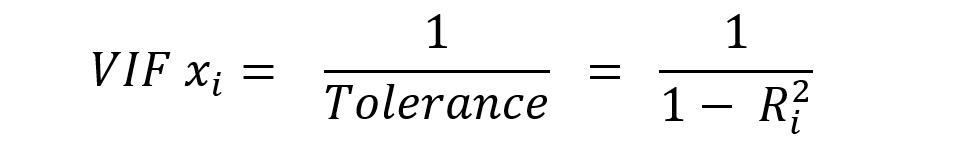
How is VIF computed?
VIF is computed by regressing an independent variable with all other independent variables.
Assume 4 independent variables X1, X2, X3, and X4.
Regress X1 with (X2, X3, and X4) to get its R-Squared (R^2) statistic. VIF of X1 = 1 / ( 1 – R^2).
Likewise, regress X2 with (X1, X3, and X4); X3 with (X1, X2, and X4); X4 with (X1, X2, and X3) to get their respective R-Squared and VIFs.
Variance Inflation Factor Code
vif
| Parameter | VIF_value |
|---|---|
| Intercept | 8.572938 |
| Mthly_HH_Income | 17.735808 |
| No_of_Fly_Members | 1.259203 |
| Emi_or_Rent_Amt | 1.026453 |
| Annual_HH_Income | 17.426934 |
How to remove multicollinearity using VIF?
Any variable having VIF above 2 is considered to be multicollinear. Drop one of the variables having VIF above 2.
Note:
1. You should drop only one variable at a time. Iterate after dropping one variable until there are no more variables having VIF above 2.
2. The thumb rule is to drop the highest VIF variable. However, you may choose to select the variable to be dropped based on business logic
3. VIF of intercept is to be ignored.
4. Some Data Scientists consider VIF above 5 instead of 2 as the threshold for multicollinearity.
From the VIF output shown above, I would recommend dropping the Annual_HH_Income variable. Why? Because we are predicting Monthly Expense and not Annual Expense.
Practice Exercise
1. Run the VIF code after dropping Annual_HH_Income variable
Final Note: Why we use VIF and not Correlation Matrix to detect Multicollinearity?
Correlation Matrix shows the correlation between any two variables (Xi and Xj). However, there is multicollinearity in data if one independent variable X1 can be predicted from one or more other independent variables (X2, X3, …. Xn). This essence of one or more is captured in VIF. As such, we use VIF to detect multicollinearity in data rather than Correlation.
<<< previous blog | next blog >>>
Linear Regression blog series home
Recent Comments