
Introduction to Descriptive Statistics
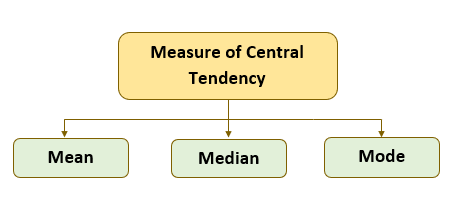
Mean, Median, and Mode are the three most common Measures of Central Tendency. They are the commonly used descriptive statistics to describe the data through a single value (central value) that represents the center point of the data. In this blog, we will learn these three very basic but most important statistical measures with practice exercises.
Mean
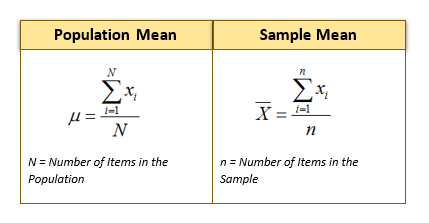
Mean is equal to the sum of all the values divided by the total number of values.
- Mean is the most commonly used measure of central tendency.
- Mean is also known as Arithmetic Average.
- Mean includes all the values in the data.
- Mean is impacted by outlier (extreme) values.
- Mean cannot be used for categorical data.
Practice Example
There are 15 Tiny Tots in a preschool and their age in months is given below. Calculate the mean age of the tiny tots.
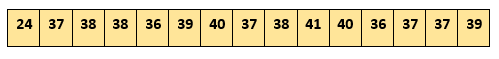
Mean = (24+37+38+38+36+39+40+37+38+41+40+36+37+37+39 ) /15
Mean =37.13
Interpretation: The average age at which parents send their tiny tots to preschool is around 37 month
Histogram
A histogram is a commonly used graphical chart to depict numerical variables. The histogram plot of the age of the Tiny Tots is shown below: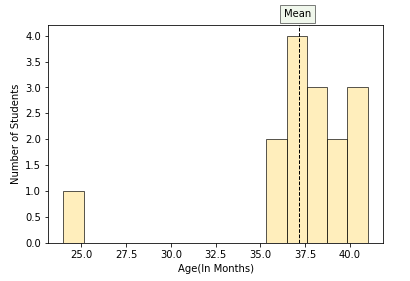
From the histogram plot, we can observe that:
- Most of the data points are distributed around mean age (37).
- The age value 24 must be a potential outlier. (Outlier values are those value which is extreme and far away from the central tendency)
Box-plot
Box-plot (a.k.a box and whisker diagram) is a very commonly used plot to find outliers in data.
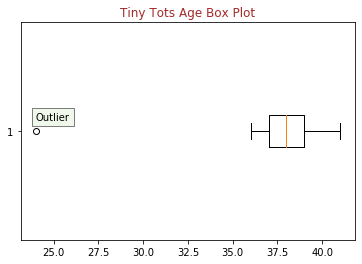
From the box-plot, we can observe that the age value 24 is an outlier.
Outlier treatment
The mean statistic is impacted by the outlier. When there are outlier values, in most scenarios we remove the extreme values, i.e., trim the data and then compute the mean. Alternatively, we use the median as the measure of central tendency.
NOTE: Sometimes despite having extreme outlier values, we compute the mean without outlier treatment and give importance to Mean statistic over Median.
The Insurance Information Institute Case*
- In 1984, the Insurance Information Institute defended high liability insurance premiums by asserting that the mean reward in product liability cases exceeded $1 Mn. Opponents of premium increases countered that the median award was only $271,000. The mean and median differed dramatically in this case because the mean was greatly inflated by a relatively few extremely large awards.
- From the point of view of reporting a typical award to the public, the median is probably superior.
- However, from the point of view of establishing premiums, the mean is probably superior. This is because the mean helps us determine the total amount that insurance companies paid out, which is the bottom line as far as the insurance industry is concerned. For example, if the mean award of one million dollars is based on 1000 liability cases, then the insurance industry paid out a total of one billion dollars.
*Ref: Business Statistics in Practice – 5th Edn – Tata McGraw-Hill page 120
Truncated Mean or Trimmed Mean
- Truncated mean is a mean obtained after trimming off values at the high and low extremes.
- Example: In a 5% trimmed mean, The mean is computed after removing 5% of the highest and lowest value from the data sample.
Practice Example
Let us remove 5% of the highest and lowest value from the below data. 5% trimming from 15 values is removing 0.75 observations, i.e. 1 observation from both the extremes. The sorted data is shown below:
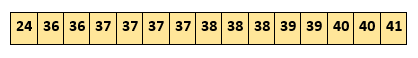
The values 24 and 41 from both extremes will get trimmed.
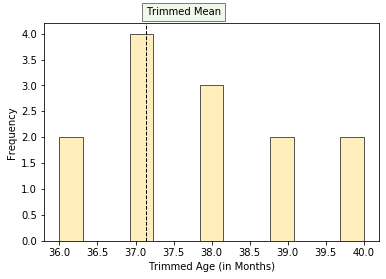
Trimmed Mean = (37+38+38+36+39+40+37+38+40+36+37+37+39 ) /13
Trimmed Mean = 37.85
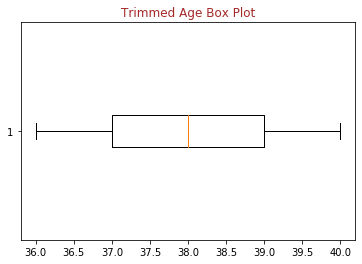
The histogram and box-plot of trimmed data are shown below and it can be observed that there is no outlier.
| Histogram | Box-Plot |
 |
 |
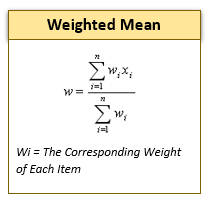
Weighted Mean
In a simple mean, we give equal weight to each value. However, there may be instances where we may have to give some more weight to certain observations than others in computing the mean and it is called Weighted Mean. In weighted mean, the value is associated with some weight based on significance, importance, or occurrence frequency. The Weighted mean is calculated as.
Example
There sample data of 15 Tiny Tots could have been shown as below. To compute the mean age we will have to give weight to the frequency of occurrence of each age value and the mean so computed is weighted mean
| Age | 24 | 36 | 37 | 38 | 39 | 40 | 41 |
| Frequency | 1 | 2 | 4 | 3 | 2 | 2 | 1 |
Weighted Mean = ((24*1) + (36*2) + (37*4) + (38*3) + (39*2) + (40*2) + (41*1)) / (1+2+4+3+2+2+1)
Weighted Mean =37.13
Median
Median is the middle value of the data when the observations are sorted (ascending or descending order)
- When sorted (ascending or descending), the median splits the data into two halves equally (upper and lower halves).
- The percentile rank of median = 50%
- Median is not calculated based on all the values in data and is therefore not impacted by outliers.
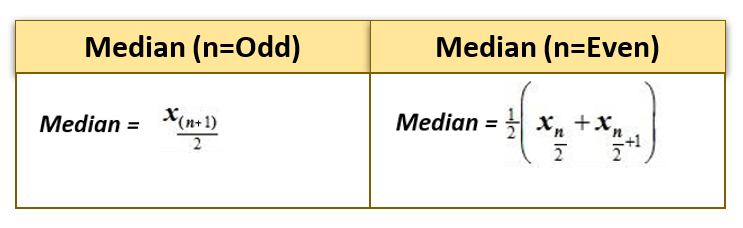
- When sorted,
- If the number of observations (n) is odd, then the median is the value of the middle observation at position (n + 1) / 2.
- Else If the number of observations (n) is even, then the median is the mean of the two middle-most values at position ( n/2, (n+1)/2 ) .
Example
There are 15 tiny tots in a preschool and their age in months is given below. Calculate median:
- To find the median, first we sort the values in ascending order (or descending)
- As n = 15 (n is odd), the median will be 8th position value [(15 + 1)/2 = 8].
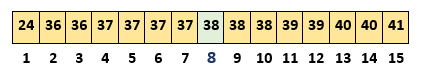
- The value at 8th position is 38, therefore Median = 38
Interpretation
50% of the tiny tots in preschool are below the age of 38 months and the remaining 50% are above 38 months.
Median vs. Mean
There are three preschools in a city and their summary details are given below. Calculate the mean and median for all the three preschools taken together.
| Preschool Name | # Children | Median Age (in months) |
Mean Age (in months) |
| Fun School | 40 | 40 | 41 |
| Play School | 20 | 36 | 35 |
| Enjoy School | 30 | 37 | 37 |
Median represents the value of the central observation in a given sample. From the above table, we cannot compute the median of all three preschools together. To be able to compute the median we will require the age at individual children level.
Mean is computed as the arithmetic average of the values in a sample data. From the above table, We can compute the mean of all three preschools together using Weight Mean calculation but not Median. Dear blog reader, I leave the calculation as a practice for you.
Practice Exercises
Practice Exercise 1
A customer has taken three loans from a bank and the tenure of each loan is 5 years
- Personal Loan of Rs. 2 Lakhs at 14% rate of interest
- Car Loan of Rs. 8 Lakhs at 11% rate of interest
- Home Loan of Rs. 40 Lakhs at 9% rate of interest
What is the rate of interest for the overall Rs. 50 Lakh?
Practice Exercise 2
A small startup has 10 employees including the founders. The monthly salaries of all the employees are given in the table below:
| Emp. No. | 1 | 2 | 3 | 4 | 5 | 6 | 7 | 8 | 9 | 10 |
| Monthly Salary (k) | 90 | 80 | 18 | 18 | 17 | 16 | 16 | 16 | 15 | 14 |
Find the mean salary?
Is mean salary the right measure? If not, then Why?
Which values in the above table are outliers? Should you trim the values from both ends? Compute the trimmed mean by removing only the outliers and not necessarily by trimming values from both ends.
Practice Exercise 3
Compute median from the below histogram.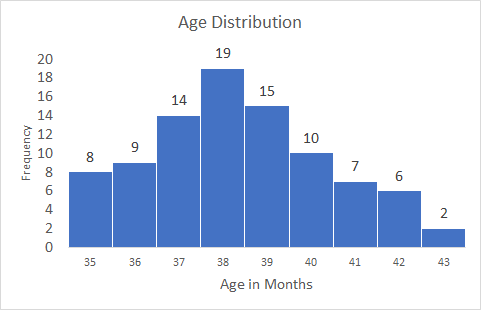
Practice Exercise 4
A small startup has 10 employees including the founders. The monthly salaries of all the employees is given in the table below. Find the median salary.
| Emp. No. | 1 | 2 | 3 | 4 | 5 | 6 | 7 | 8 | 9 | 10 |
| Monthly Salary (k) | 90 | 80 | 18 | 18 | 17 | 16 | 16 | 16 | 15 | 14 |
<<< previous blog | next blog >>>
<<< statistics blog series home >>>
Recent Comments