
Interquartile Range
Interquartile Range (IQR) is the range of the middle 50% of the values in the data distribution. It is the difference between the third quartile(Q3) and the first quartile(Q1).
- Formula:
IQR = Q3 – Q1
Quartiles
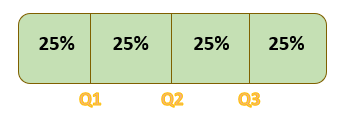
Quartiles divide the rank-ordered data distribution into four equal parts. The values that separate parts are called the first, second, and third quartiles (Wikipedia link)
- First Quartile (Q1): It is the median of the lower half of the data distribution (25th percentile)
- Second Quartile (Q2): It is the median of the entire data distribution (50th percentile)
- Third Quartile (Q3): It is the median of the upper half of the data distribution (75th percentile)
Example
We will use the small start-up example having 10 employees as discussed in our earlier blog on Range. The monthly salary of the employees is given in the table below. Find the quartiles and interquartile range of the salary.
| Emp. No. | 1 | 2 | 3 | 4 | 5 | 6 | 7 | 8 | 9 | 10 |
| Monthly Salary (k) | 90 | 80 | 18 | 18 | 17 | 16 | 16 | 16 | 15 | 14 |
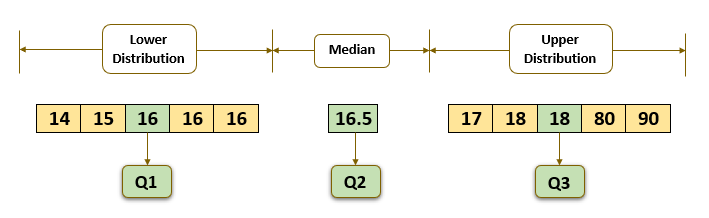
Second Quartile
Let us first calculate the second quartile (Median).
- Sort the values in ascending order

- The number of observations, n=10 (even), therefore Q2 is mean of (n/2)th observation and ((n/2) + 1)th observation
- Q2(median) = (1/2) * (5th observation + 6th observation)
Q2 = (16 + 17) / 2
Q2 = 16.5
First Quartile
Now, let’s calculate the first quartile (Q1)
- Q2 is the median. It splits the dataset into the upper and lower half of the distribution.
- Q1 is the median of the lower half of the distribution (90,80,18,18,17). The number of observations is 5, it is an odd number. As such Q1 is the value at 3rd position, (n+1) / 2.
- Q1 = Value at 3rd observation
Q1 = 16
Third Quartile
- Q3 is the median of the upper half of the distribution (16,16,16,15,14). The number of observations in the upper half also is 5. As such Q3 will be the value at 3rd position in the upper half of the data.
- Therefore Q3 = 18
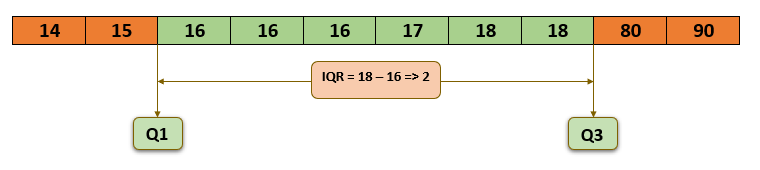
Interquartile Range (IQR)
- The three quartiles that divide the data distribution into four equal parts are:
- Q1 = 16; Q2 = 16.5; Q3 = 18;
- IQR = Q3 – Q1 = 18 – 16
- IQR = 2
Outliers do not impact Interquartile Range statistic
- Interquartile Range (IQR) is the range of the middle 50% of the values in the data distribution. IQR is also called the midspread or the middle 50%. It only considers values between Q3 and Q1. It omits the top and the bottom 25% of values in the sorted data distribution.
- IQR omits the extreme values (80,90), hence it is not impacted by the outliers. When the data have outliers, IQR is the best measure of dispersion.
Outlier Detection
One of the commonly used formula to find outliers on the lower and higher side is:
- If there is any value below (Q1 – 1.5 * IQR) then it is considered to be an outlier. In statistics, (Q1 – 1.5 * IQR) is called Lower Control Limit (LCL).
- Likewise, any value above (Q3 + 1.5 * IQR) is also considered as an outlier. The computation of (Q3 + 1.5 * IQR) is called Upper Control Limit (UCL)
Practice Exercise
Sample data of 15 students participating in the Machine Learning Certification Program conducted by K2 Analytics is given below. Calculate the interquartile range.
| Sr. No | Age of Students (in Years) |
| 1 | 22 |
| 2 | 23 |
| 3 | 25 |
| 4 | 27 |
| 5 | 28 |
| 6 | 35 |
| 7 | 32 |
| 8 | 28 |
| 9 | 30 |
| 10 | 40 |
| 11 | 24 |
| 12 | 26 |
| 13 | 27 |
| 14 | 29 |
| 15 | 31 |
Next Blog
Our next blog is on Standard Deviation.
Recent Comments