What is Regression?
Regression is a statistical process for estimating the relationship between a dependent variable (usually denoted by y) and one or more independent variables (usually denoted by x).
Dependent Variable – The variable whose value is dependent on other variables. Another way of saying the same thing is, the variable whose value can be estimated from some other input variable is called a dependent variable.
E.g. “Monthly Household Expense” is dependent on the “Monthly Income” level of the household.
Independent Variable – The variable which is used to estimate the value of the dependent variable is called an independent variable. The other terms for “independent variable” are “predictor variable” or “explanatory variable”.
From the above e.g., we can say “Monthly Household Income” is the independent variable.
Assume, you have surveyed 500 households and collected their Monthly Income & Monthly Expense details. You wish to find a mathematical relationship between Expense and Income. The statistical technique used to analyze such data is the Regression technique. The most commonly used regression technique is Linear Regression.
Linear Regression
Linear Regression is the linear approach of modeling the relationship between a scalar (dependent) variable and one or more explanatory (independent) variables. Linear Regression Model types:
- Simple Linear Regression – there is only one explanatory variable
- Multiple Linear Regression – more than one explanatory variable
Mathematically, the equation defining the Linear Regression is:
y = a + bx + e
Where:
x is an independent variable
y is dependent variable
a is the y-intercept, the expected value of y when x = 0
b is the slope of the regression line and is called the beta coefficient
e is the random error term
Data
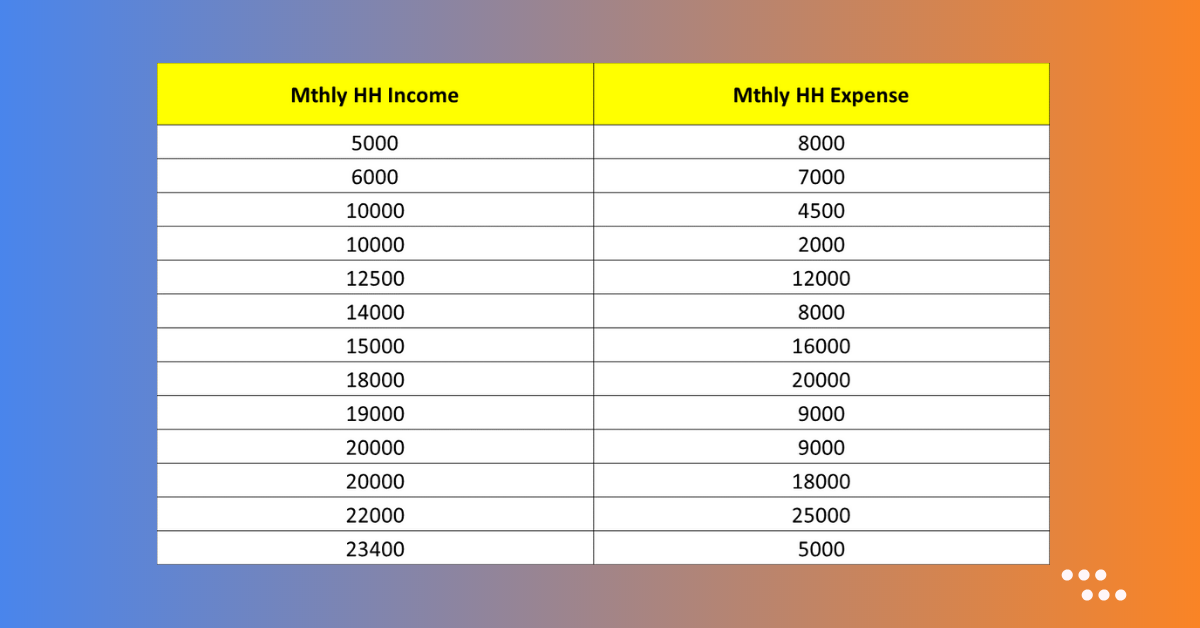
To explain the concept of Linear Regression, we will use household survey data having Monthly Income and Monthly Expense details of the households. The table below shows a few sample records of the survey. Click here to download the survey data from our Resources section.
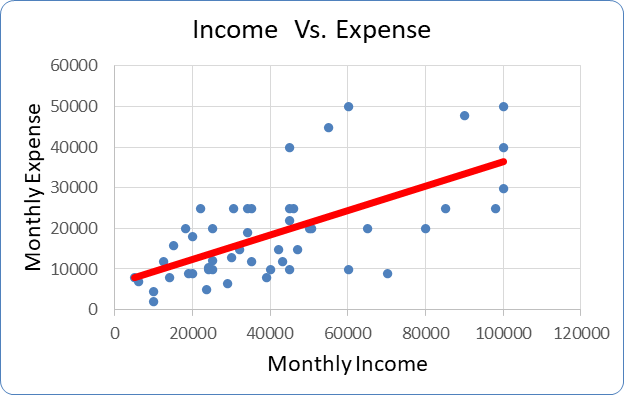
Scatter Plot: The plot below shows the distribution of the Monthly Household Income vs. Expense.
Line of Best Fit
A line of best fit is a straight line that best fits the data on a scatter plot when the relationship between the dependent and independent variables is linear.
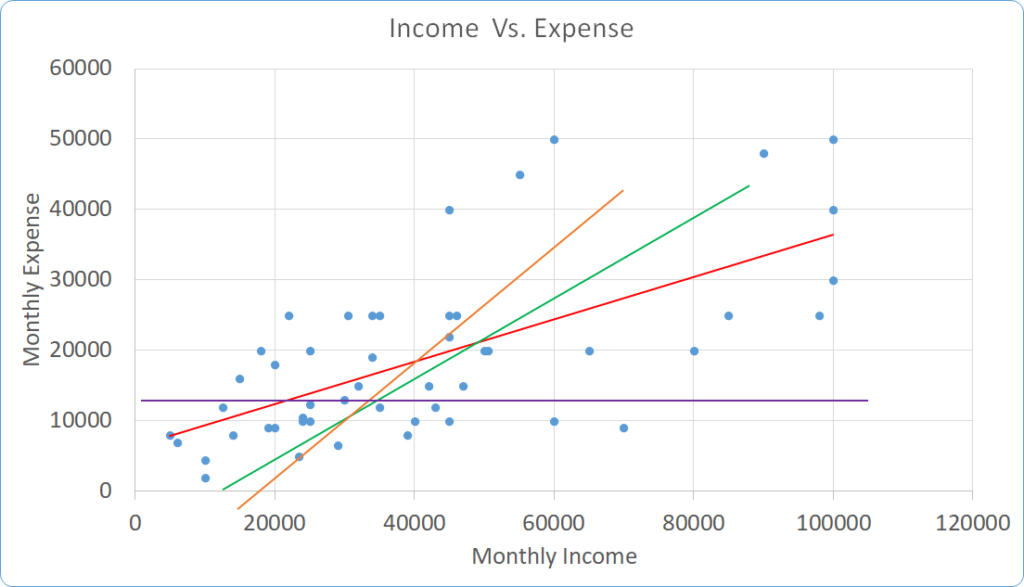
In the image shown below, we can have millions of straight lines on the scatter plot. The question is: Which line will be the Line of Best Fit?
The Line of Best Fit is the line that passes very closely through most of the data points. Mathematically, the Line of Best Fit is the line minimizing the total Sum of Squared Error.
What is the Sum of Squared Error?
Let us assume that the red line as shown below in the scatter plot is the line of best fit.
“y” denotes the actual value of the dependent variable (Monthly Expense).
“ŷ” (y-hat) symbol denotes the estimated value of the dependent variable.
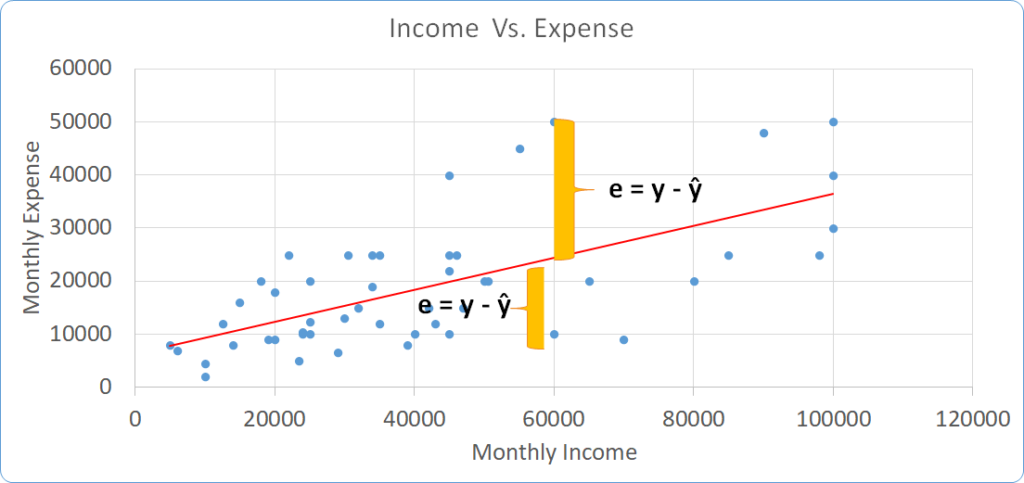
Error is the difference between the Actual and Estimated value: e = y – ŷ
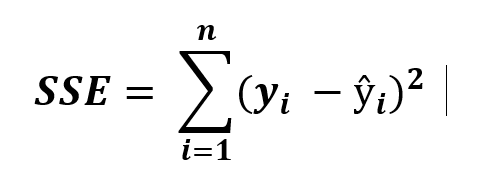
Squared Error is simply the square of the error term, i.e. (y – ŷ)^2
Sum of Squared Error (SSE) is the summation of the squared error term taken across all data points
Linear Regression Model Development
Continue reading our next blog to build the Linear Regression Model in Python and R.
<<< previous blog | next blog >>>
Linear Regression blog series home
Explained in simple manner
Love it!