In this blog, we will learn to build a single variable logistic regression using Python and also interpret the model summary output. Business Objective Overview MyBank wishes to develop a...
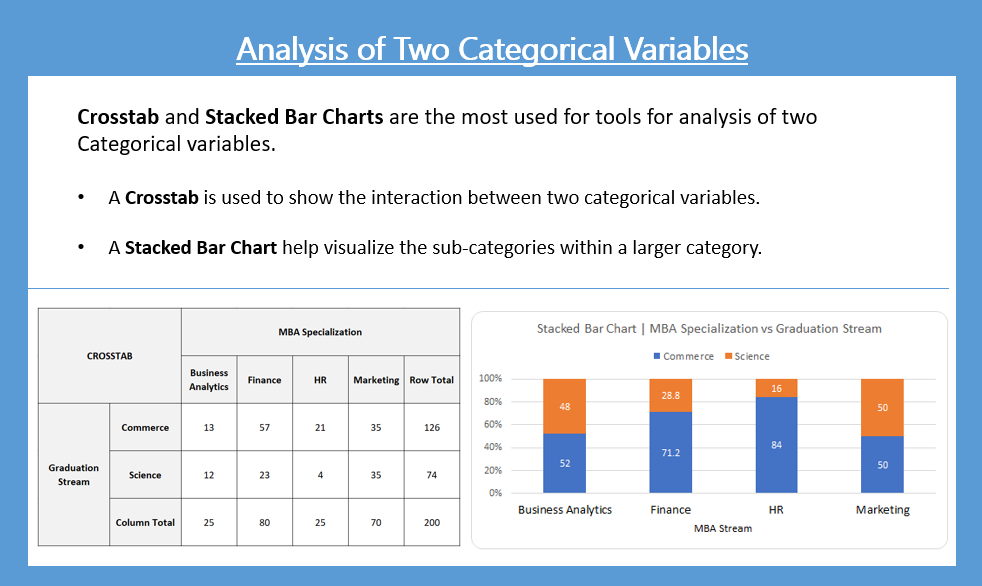
Analysis of Two Categorical Variables Crosstab is the most preferred way of analyzing two categorical variables. It helps you to identify the affinity between the two categories. Graphically a...
Analysis of Two Continuous Variables Scatter plot and Correlation are a great way of analyzing two continuous variables. A Scatter plot quickly helps us see the relationship between two continuous...
Analysis of Single Continuous Variable Histograms are a great way of analyzing a single continuous variable. The histogram is an approximate representation of the distribution of numerical data. It...
A single categorical variable is mostly analyzed by Frequency Distribution. A table or a graph displaying the occurrence frequency of various outcomes is called Frequency Distribution. The commonly...


Recent Comments