
Introduction to Classification Tree
Classification Tree is a Supervised Machine Learning Technique. It is used when data has two or more classes and your objective is to find the defining characteristics for each of the classes. Pros of this technique are:
- it is very simple & easy to understand
- the output is in the form of a hierarchical tree thereby making interpretation very easy
Preamble to the case-study
All the banks in India have a huge portfolio of Savings Account customers. Moreover, many of their customers typically maintain Savings Account with more than one bank. There are many reasons why a customer ends up keeping multiple bank accounts:
- Change in Salary Account
- Change in Location
- Unhappy with services of the earlier bank
- and many more reasons
Of the multiple accounts, one of the accounts is Primary Account and the other accounts are Secondary Account. A customer does most of his/her transactions from the Primary Account. The Secondary Account is a less used account and often there is no transaction in it for many months.
Dormant (Dud) Account – An account having no transactions for recent last 6 months is typically classified as a Dormant Account by the bank.
It is generally observed that 40% of the Savings Account Portfolio is dormant.
Dormant Account Win Back Case-Study
Business Challenge
- The challenge for the Bank was to get the Dormant Accounts activated, i.e. Win-Back the Dormant Customers
- The account base was too huge to target everyone. The overall base of the bank was 40 Crore accounts ( 400 Million) and 40% of it was dormant. Total Dormant Accounts = 40 Cr * 40% = 16 Crore
Dormant Account Win-Back Campaign Design
The Bank decides to run a pilot campaign to identify customers to whom they can Win-Back. A random sample of 100,000 customers is selected to whom the campaign communication is sent through multiple touchpoints like email, SMS, direct mail, IVR, phone banking, calls from relationship mangers, etc is done.
- The cost of sending the campaign = Rs. 25/-
- The cost of fulfillment = Rs. 350/-
Campaign Response
10% of the customers responded to the offer. They deposited a sum of Rs. 25000/- and were willing to maintain minimum Avg. Monthly Balance of Rs. 25000/- going forward.
A good number of customers who reactivated their account got fresh debit card issued, lien charges waived off, password regenerated, etc for free.
Classification Tree Model
A classification tree model was built based on the campaign data. The two classes in the data were:
- Win Back: Customers who activated their accounts by giving 25K cheque
- No Win Back: Customers who did not activate
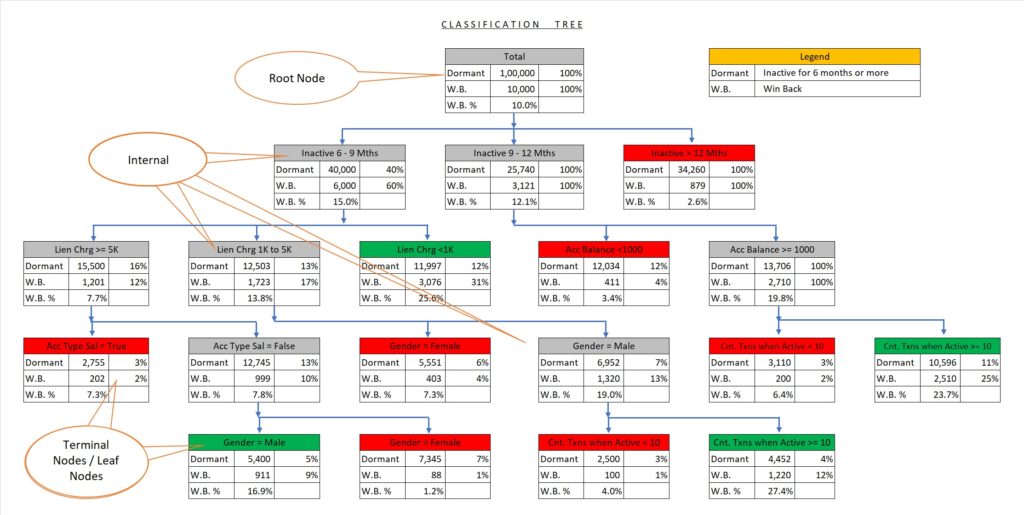
The classification tree model output is shown below.
Classification Tree Terminologies
- Root Node: The starting node having all records is called the Root Node.
- Terminal Node: The Root Node is split into child nodes based on important attributes decided by the splitting criteria in the account. The child node, Inactive > 6 months is not split further. A child node which is not split further is called Terminal / Leaf Node
- The child nodes which are split further, i.e not terminal are called Internal Node
Interpreting the Classification Tree Output
The win-back rate at the root node is 10%. It simply means that if we continue running campaigns without applying classification filters then we would get approximately 10% Win Backs from Dormant Accounts.
If we apply the Length of Inactivity filter then it is observed that the winning back probability decreases sharply as the inactivity period increases. Only 2.6% Win Back is observed in customers that have been inactive for more than 12 months.
25.6% is the Win Back rate observed in Accounts with Inactivity less than 6 months and Lien Charge less than Rs. 1000/-
A close observation of all the terminal nodes reveals that a few terminal nodes have a very high Win Back Rate as compared to an overall win back rate of 10%. These terminal nodes have been marked as Green. The other terminal nodes with a relatively lower win back rate are marked as Red.
The profiling characteristics of a Terminal Node is set of splitting criteria starting from the Root Node till the Terminal Node. For e.g. the profiling characteristics of the Terminal Node marked Green and having 5400 dormant accounts is “Inactive 6 – 9 Mths & Lien Charge >= 5K & Acc Type Sal = False & Gender = Male”.
ROI Calculations at Root Node
Given:
- cost of campaign per customer = Rs. 25/-
- The average cost of fulfillment per Win-Back Account = Rs. 350/-
- Average Balance maintained = Rs. 25000/-
- Interest Margin earned by the bank by lending the deposits account money to borrowers = 2%
Campaign Cost = 100000 * 25 = 2500000 = 2.5 MM
Cost of Fulfillment = # Win Back * Avg. Fulfillment Cost
= 10000 * 350 = 3500000 = 3.5 MM
Revenue considering 1st year Interest Margin
= #Win Back * Avg. Monthly Balance * Interest Margin
= 10000 * 25000 * 2% = 5000000 = 5 MM
Profit or (Loss) = 5MM – 2.5MM – 3.5MM = -1 MM From the above calculations it is clear that the campaign will not be profitable in the first year. For the campaign to be profitable we need more Win-Back such that:
Interest Margin Revenue = Campaign Cost + Fulfillment Cost
#W.B. * 25000 * 2% = 100000 * 25 + #W.B. * 350
#W.B. = 16667
Required Win-Back Rate for campaign to be profitable = 16667 / 100000 = 16.67%
Deployment Strategy
From the ROI calculation, we understand that the campaign will be profitable only if we get a 16.67% win-back rate or more.
From the classification tree, target only those terminal nodes where the Win-Back rate is more than 16.67%. In the image above, the terminal nodes marked Green have a win-back rate more the 16.67%
Calculations considering All Green Nodes:
Sum of Dormant Accounts = 11997 + 5400 + 4452 + 10596 = 32445
% of Total Accounts = 32445 / 100000 = 32.4%
Sum of Win Back = 3076 + 911 + 1220 + 2510 = 7717
% of Total Win Back = 7717 / 10000 = 77.17%
Win Back Rate = 7717 / 32445 = 23.78%
32.4% of total dormant accounts are in Green Nodes and it has 77.17% of the total Win Back, i.e. by targeting only 32.4% of dormant accounts we can get the 77.17% of the total potential win-back accounts.
Green Segment Profitability
= 7717 * 25000 * 2% – 7717 * 350 – 32445 * 25
= 346425
Pilot Rollout to Full-fledged Rollout
Going forward, the Bank can classify the Dormant Accounts using the Classification Tree model and target only those Dormant Accounts which fall in the Terminal Nodes marked as Green.
Dormant Accounts = 160 MM
Potential Targetable Base = 160 MM *  32.4% = 51.84 MM.
Expected Win-Backs = 51.84 MM * 23.78% = 12.3 MM
Deposit Mobilization = 12.3 MM * 25000 = 307500 MM
Profit = 307500 MM* 2% – 51.84 MM * 25 – 12.3 MM * 350
= 549 MM
Sign-Off Note:
Dormant Account Win-Back campaign is a low hanging fruit by which banks can quickly mobilize deposits, grow their savings account portfolio, weed out inactive accounts, and build loyalty with their existing customers. In the upcoming blog, we will discuss the Classification Tree Algorithm.
Our Official Meetup Page: Data Science Mumbai
Recent Comments