Our Training Programs
- Python Programming
- R Programming
- SQL Programming
- Big Data PySpark Programming
- Statistics & EDA
- Data Engineering / ETL
- Machine Learning Algorithms
Training Program Outline
- Basic Must Know things in Excel
- Introduction to Excel
- Insert, Delete, Rename Sheets
- Cut-Copy-Paste, Paste Special
- Some commonly used Excel Shortcuts
- Drag & Drop, Fill handle
- Cell Formatting (Colour, Border, Alignment, Row Height, Column Width, Format Painter), Merge Cells
- Number Formatting (General, Text, Currency, Date, Comma, Percentage)
- Absolute & Relative Cell Referencing
- Data Handling in Excel
- Name Manager & Data Tables
- Data Text to Columns (Delimited / Fixed Width Files)
- Data Filter, Sort, Remove Duplicates
- Data Validation & Conditional Formatting
- Linking Sheets
- Functions & Formulae
- Basic functions like sum(), count(), average(), etc
- IF & Nested IF, sumif/s, countif/s, counta
- VLookup, HLookup, XLookup
- Match, Index, Offset
- Text Functions (trim, concat, left, mid,…)
- Date Functions (date, datevalue, day, month, year, etc)
- matplotlib & seaborn
- ISERROR, IFERROR, ISNUMBER, ISTEXT, ISODD, ISEVEN
- Data Summarization
- Pivot Tables & Introduction to PowerPivot
- Data Grouping & Outline
- Sub-Total
- Protecting Data
- Overview of Data Protection
- Protecting Workbooks, Worksheets, Cells & Ranges
- Hiding Data & Formulas
- Securing Workbook Structure & Formats
- Data Visualization – Charts & Graphs
- Capstone Project in Excel
COURSE DURATION
2 Days (16 Hours)
- Introduction to Python and Anaconda
- Getting Started with Jupyter Notebook
- Understanding Python Data Structures
- list, tuple, dictionary, set
- Mutable & Immutable Objects
- Python Packages
- os, sys, math
- numpy & pandas
- matplotlib & seaborn
- pickle
- date, datetime
- Programming Structures in Python
- if-else, if-elif-else
- for loop, while loop
- break, continue, pass
- Python Functions
- built-in string, date, math functions
- string to date conversion
- date to string conversion
- lambda functions
- usage of map, filter, apply with lambda functions
- user-defined functions
- local and global scope of variables
- window functions: lag, lead, rank, dense rank, etc
- Data Manipulation
- Data Import & Export
- Pickle Data (Load & Save)
- Create New Variable / Drop Column
- Merge, Append, Sort, Filter
- Data Aggregation
- Drop & Reset Index
- Error Handling in Python
- Types of Error
- Try – Except – Else – Finally
- Object Oriented Programming
- Class & Inheritance
- Polymorphism
- Capstone Project in Python
COURSE DURATION
3 Days (24 Hours)
- Big Data Hadoop & Spark Overview
- Overview of Hadoop & Distributed Storage
- Overview of Spark Eco-System & Distributed Computing
- Spark Programming Concepts
- SparkSession & SparkContext
- Resilient Distributed Dataset (RDD)
- RDD Fault Tolerant & Data Partitions
- RDD vs DataFrame
- PySpark DataFrame vs Pandas DataFrame
- Directed Acyclic Graph (DAG) & Lineage
- Transformation, Action, & Lazy Evaluation
- Data Persistence
- Functional Programming
- Working with Spark RDD
- Creating Spark RDD
- Some common transformations: map(), reduce() & filter
- Some common actions: count(), take(), collect()
- Map-Reduce Word Count Example
- Working with DataFrame
- Spark SQL
- Importing Data as DataFrame from File System, HDFS, Database
- StructField & StructType (pyspark.sql.types)
- PySpark Functions (pyspark.sql.functions) & User Defined Functions (UDF)
- Data Management in PySpark
- Create / Drop Variables
- Merge (Joins), Append, Sort, Filter
- Sort Merge Join vs Broadcast Join
- Data Aggregation
- Date Handling
- Data Persistence: persist() & cache()
- Interoperating between RDD & DataFrame
- Window Functions (pyspark.sql.window): rank(), dense_rank(), lag(), lead(), etc
COURSE DURATION
2 Days (16 Hours)
- Database Basics
- What is Database?
- What is Schema?
- SQL Programming & ANSI Standards
- Applications of Database (OLTP & OLAP)
- ACID Properties
- Introduction to SQL Programming
- Types of SQL Queries: DDL, DML, DCL
- DDL – Data Definition Language
- DML – Data Manipulation Language
- DCL – Data Control Language
- Data Types: Character, Numeric, Date, Boolean, BLOB
- Data Definition Language
- CREATE, ALTER, and DROP
- Primary Key, Foreign Key, and Unique Key
- Null, Not Null, and Check Constraints
- Default Value
- Auto Increment Column
- Indexes
- Data Modeling Concepts
- Conceptual, Logical, and Physical Data Model
- ER Model & Normalization (OLTP)
- Dimensional Model & Denormalization (OLAP)
- Star & Snowflake Schema
- Data Manipulation Language
- INSERT, UPDATE, DELETE Queries
- SELECT Queries, Sub-Queries, and Common Table Expressions
- Commonly used String, Date, and Math Functions
- Dimensions and Measures Concept in SQL Group By Aggregation queries
- Commonly used aggregation functions: count(), sum(), min(), max(), and avg()
- TRUNCATE Table
- Usage of IN, NOT IN, EXISTS & NOT EXISTS in SELECT Queries
- Indexes and their importance in SELECT Query
- Clustered Index
- Non-Clustered Index
- JOINS
- Inner, Full Outer, Left, and Right Outer Join
- Semi & Anti Join
- Window Functions
- row_number(), rank(), dense_rank()
- lag(), lead()
- Partition By, Order By, Rows Preceding and Following
- Overview of Advanced Topics
- Views, User Defined Functions, Stored Procedures, Cursors, and Triggers
- Capstone Project
COURSE DURATION
2 Days (16 Hours)
- Introduction to R Programming
- Understanding R Data Structures
- scalar, vector, list, matrices
- dataframes
- use of c(), cbind(), rbind(), ls(), rm() functions
- Data Import & Export
- csv, fixed width file, MS Excel
- saving and loading R Workspace
- exporting data to .csv file format
- Data Manipulation
- create / drop Variables
- data merge (joins) – inner, outer, left, right
- data append
- data sorting, filtering
- data aggregation
- Programming Structures
- if-else conditional statements
- for loop, while loop
- Functions
- built-in string, date, math functions
- user-defined functions
- local & global scope of variables
- Basic Charts & Graphs
- overview of univariate & bivariate analysis
- sample plots like line plot, bar plot, scatter, histogram, and pie chart
COURSE DURATION
2 Days (16 Hours)
- Introduction to Statistics for Data Science
- Types of Variables
- Numerical & Categorical
- Numerical: Discrete & Continuous (Ratio & Interval)
- Categorical: Ordinal & Nominal
- Descriptive Statistics – Numerical Methods
- Measures of Central Tendency (Mean, Median, Mode)
- Measures of Dispersion (Range, IQR, Standard Deviation, Variance)
- Measures of Relationship (Covariance and Correlation)
- Univariate, Bivariate, and Multivariate Analysis
- Descriptive Statistics – Tabular & Graphical Methods
- Bar Plot, Stacked Bar Plot, Pie Chart
- Histogram, Density Plot, Box Plot
- Scatter Plot
- Line Plot
- Probability Concepts
- Sampling Theory & Types
- Simple Random Sampling
- Stratified Sampling
- Cluster Sampling
- Distributions
- Normal Distribution
- Empirical Relationship between Mean & Standard Deviation
- Standard Normal Distribution
- Z Score
- Central Limit Theorem
- Law of Large Numbers
- Hypothesis Testing
- Null & Alternate Hypothesis
- p Value & Significance Level
COURSE DURATION
3 Days (24 Hours)
- Supervised Machine Learning
- Linear Regression
- Logistic Regression
- Classification Tree
- Naive Bayes
- KNN
- Bagging & Boosting
- Neural Networks
- Unsupervised Machine Learning
- Clustering (K means & Hierarchical)
- Modeling Concepts
- CRISP-DM (Cross Industry Model Development Process for Data Mining)
- Target Variable Definition
- Modeling Window Definition
- Train & Test (Dev-Val-Holdout)
- Model Validation / Cross-Validation
- Information Value & Weight of Evidence
- Outlier Treatment
- Missing Value Imputation
- Pattern Detection and Trend Fitting
- Multi-Collinearity & Variance Inflation Factor
- Model Performance Measures
- Rank Order Table & Gains Table
- KS, Lift Chart
- AUC, Concordance
- Profitability Analysis
- Gini Coefficient
- Classification Accuracy, Sensitivity, Specificity
- RMSE, R-Squared, Adj. R Squared
Training Pedagogy
Hands-on, Problem Solving & Case-Study Based Approach
Recorded Content
Access to Recorded Videos on our eLearning Portal

Rajesh Jakhotia
Instructor
Rajesh is an Analytics Professional with 20+ years of experience. He started his analytics career with Fractal Analytics in year 2003. He is an Adjunct Faculty at Great Learning.
His past work experience includes working with Fractal Analytics, Sutherland Global Services, Hansa Customer Equity and Positive Integers providing Analytics Consultancy for some of the marquee Indian Banks & NBFCs like HDFC Bank, Axis Bank, Kotak Mahindra Bank, India Infoline.
His expertise includes building Machine Learning Models for Risk Management and Marketing. He has worked on tools like Python, R, SAS, SQL.
He successfully completed the Senior Management Program from IIM-C. He is an Engineering Graduate from V.J.T.I, Mumbai University. He is also Oracle Certified Associated and Project Management Program certified from PMI.
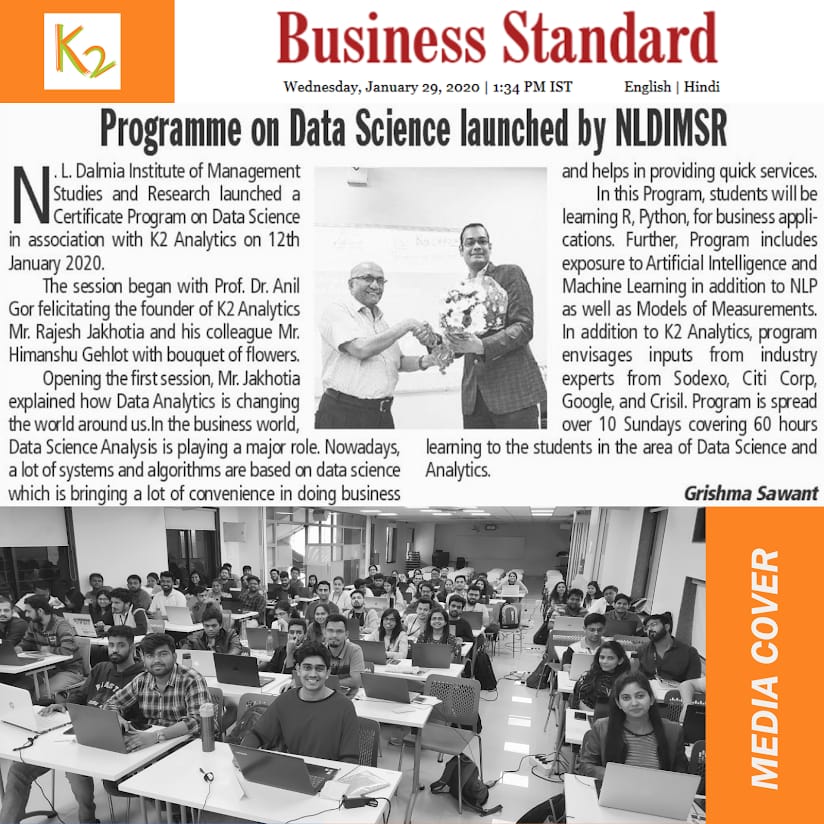
Training Gallery


Capstone Projects
Our programming capstone projects are designed to present real-life programming scenarios to the learner. The capstone tests the ability of the programmer to develop logic and build end-to-end solutions. The capstone is designed to cover programming knowledge areas like:
- Data Import & Export
- Understanding of Data Structures
- Understanding of Programming Structures: Conditional Statements (if-else, if-else-if) and Looping Structures (for loop, while loop)
- Basic Data Manipulation activities like creating a new column, dropping a column, renaming a column, and data type transformation.
- Filter Data, Data Merge (Join), Data Append, Data Aggregation, and Data Sorting
- Usage of Window Functions like Lag, Lead, Rank, Dense Rank, etc.
An IT company has more than 100000 employees and have a very high attrition rate. The business environment is very competitive, and the cost of replacement is much higher than the cost of retaining an existing employee. If a skilled employee resigns the replacement involves cost of hiring and training. There is also some loss of efficiency till the new employee comes to speed.
The IT company sample data has been provided. HR Department of the company is looking for an attrition model that can help identify the employees who are likely to resign. Based on the model, HR will build an employee retention strategy and they have estimated that they can save more than Rs. 100 Million if they reduce the attrition rate by 0.5%.
As a Data Scientist our goal is to build Employee Attrition Model
A bank in Middle East would like to build Credit Default Model for their Home Loans portfolio. The model is an Application Scorecard for Home Loans and it will be used to evaluate credit worthiness of future customers applying for home loans.
The data of about 20000 loans customer with their default status has been provided. The data is a mix of expats and locals. The demographic details, income details and loan related parameters have been provided.
You have been assigned the task of building Application Scorecard for Home Loans using Logistic Regression Model. The probability of default as predicted by the model has to be converted into credit score such that a total score of 600 points corresponds to good/bad odds of 50 to 1 and an increase of the score of 20 points corresponds to a doubling of the good/bad odds.
MyBank wish to develop Direct Marketing channel by cross-selling various banking products and services to their existing customer base. The bank executed a pilot campaign to sell personal loans to their deposit account holders. The campaign offer was communicated to the customers through email, sms, and direct mailers.
The customers were incentivized to respond by giving the loan at 1% rate lower than market rate along with the processing fee waiver if the customer availed the loan within 15 days time period.
The demographics and behavioural variables along with responder / non-responder of the campaign has been provided. You have been assigned the task to build a Predictive Model to find profitable segments for cross-selling personal loans. Along with the model you must provide the model implementation and deployment strategy for future campaigns.
Sample E-Certificate

Testimonials
We had invited Mr Rajesh from K2 Analytics to conduct a workshop on Machine Learning and R Programming. The workshop was very well appreciated by all the participants. We are thankful for your time and the knowledge shared with us. I would like to rate the training 5 out of 5 for the training quality, content and the case-study way of explaining the topic which struck the right chord with the audience who were from the First Year and Second Year of Engineering. Thanks, k2analytics.
Within 2 months of Machine Learning course commencement, my perspective of looking at data had changed drastically. It helped me to present my existing reports and dashboards with insightful information. It is truly said “If you don’t know the business, data can teach you.” Complex terms were explained in a very elegant and simpler way to make it very easy to understand. The industry experience regularly shared by the trainer helps a lot. Many thanks to K2 Analytics!
I think joining K2 has been one of the best decision i have made in my career. Rajesh sir is very passionate instructor with immense knowledge in most demanding domain of this era and has great teaching skills, he keeps it simple for us to understand any complex concepts. I joined here with level-0 analytics skills but now after machine learning with R session i think I am ready to transform myself into analytics domain. I would highly recommend K2 Analytics to those who aspire to make career in Analytics domain.
4000+ STUDENTS POSITIVELY IMPACTED
100+ HOURS OF TRAINING VIDEOS
FAQ’s
What is the median salary of a Data Scientist in India ?
According to the report, the median salary being offered for analytics jobs in India is INR 11.5 lakhs/annum.
What is Data Science ?
Data science is a multi-disciplinary field that uses scientific methods, processes, algorithms, and systems to extract knowledge and insights from structured and unstructured data.
Is Data Science a good career option ?
A Big YES, Data Science is a good career option. The U.S. Bureau of Labor Statistics reports that the rise of data science needs will create 11.5M job openings by 2026. According to IBM, the demand for Data Scientists will increase up to 28% by the year 2020.
Best way to learn Data Science as a beginner ?
Make sure you are guided by an experienced Professional Faculty in DATA SCIENCE.